2019-12-20 10:25:00


LNG IMPORTS FOR EUROPE UP
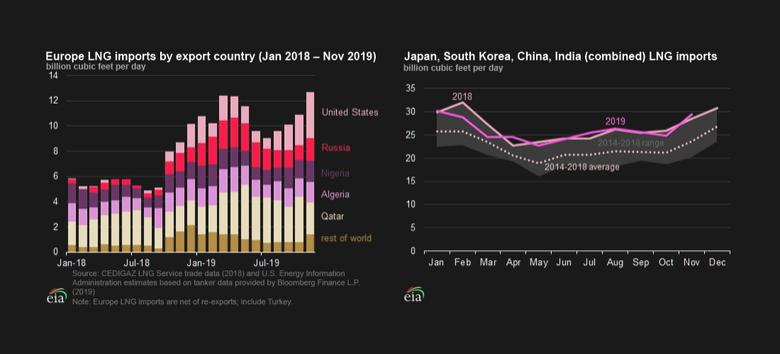
U.S. EIA - Europe’s imports of liquefied natural gas (LNG) have been steadily increasing since October 2018, and reached a new monthly record of 12.7 billion cubic feet per day (Bcf/d) in November 2019, according to the U.S. Energy Information Administration (EIA) estimates based on Bloomberg Finance L.P. tanker shipment data. This monthly record implies a 51% utilization of Europe-wide regasification capacity (including Turkey). From January through November 2019, LNG imports into Europe averaged 11 Bcf/d—the highest level for European LNG imports—surpassing the previous record of 8 Bcf/d (annual average) set in 2011. Lower spot LNG prices in Asia have narrowed the price differentials between delivering LNG to Asia or to Europe and have contributed to increased cargo shipments to Europe.
LNG imports into Europe have been relatively low in recent years. This year, however, spot natural gas prices in Europe declined to a 10-year low, providing incentives for increased electric generation from natural gas-fired power plants. Strong demand growth in the power generation sector combined with declining natural gas production in the United Kingdom and the Netherlands, required larger volumes of natural gas imports by both pipeline and as LNG. Lower natural gas demand in Asia has freed up more destination-flexible LNG cargoes that were shipped to Europe.
This year, three LNG suppliers to Europe—Qatar, the United States, and Russia—have increased their LNG exports to the region by a combined 3.7 Bcf/d in the first 11 months of 2019, compared with LNG exports to Europe by these suppliers in 2018 (annual average). The United States had the largest increase, with LNG exports growing from 0.4 Bcf/d in 2018 to 1.8 Bcf/d in the first 11 months of 2019, followed by Russia (1.3 Bcf/d increase), and Qatar (1.0 Bcf/d increase). Other suppliers to Europe, including Nigeria, Trinidad & Tobago, and Algeria, increased LNG exports by 0.3 Bcf/d each in 2019 (January–November) compared with the annual average for 2018.
Major Asian LNG consumers—Japan, China, South Korea, and India (accounting for 65% of global LNG imports in 2018)—imported an estimated 26.1 Bcf/d of LNG between January and November 2019, 0.7 Bcf/d (3%) less than in all of 2018. In particular
- Both Japan and South Korea reduced LNG imports by an estimated 0.8 Bcf/d and 0.6 Bcf/d, respectively, in January–November 2019. In Japan, natural gas consumption was affected by lower demand for natural gas-fired generation following the restart of five nuclear reactors and increased generation from renewable sources, particularly solar. Similarly, in South Korea, LNG imports decreased as a result of higher generation from nuclear units (several of which were restarted in 2019 after an extended maintenance period last year), higher generation from the renewables, and an overall lower electricity demand.
- LNG imports in China, after growing by more than 40% from 2017 to 2018, experienced a slower growth from January through November 2019. Slowing economy and warm weather have negatively impacted LNG imports in October–November 2019, the peak LNG buying season.
- Although LNG imports in India remained flat in 2019, imports are likely to increase next year once the new regasification terminals and connecting pipelines are placed in service.
-----
Earlier:
All Publications »


