2019-12-06 13:05:00


U.S. INTERNATIONAL TRADE DEFICIT $47.2 BLN
U.S. BEA - DECEMBER 5, 2019 - U.S. International Trade in Goods and Services, October 2019
The U.S. Census Bureau and the U.S. Bureau of Economic Analysis announced today that the goods and services deficit was $47.2 billion in October, down $3.9 billion from $51.1 billion in September, revised.
| Deficit: | $47.2 Billion | -7.6%° |
| Exports: | $207.1 Billion | -0.2%° |
| Imports: | $254.3 Billion | -1.7%° |
|
Next release: January 7, 2020 (°) Statistical significance is not applicable or not measurable. Data adjusted for seasonality but not price changes Source: U.S. Census Bureau, U.S. Bureau of Economic Analysis; U.S. International Trade in Goods and Services, December 5, 2019 |
||
Exports, Imports, and Balance (exhibit 1)
October exports were $207.1 billion, $0.4 billion less than September exports. October imports were $254.3 billion, $4.3 billion less than September imports.
The October decrease in the goods and services deficit reflected a decrease in the goods deficit of $3.7 billion to $68.0 billion and an increase in the services surplus of $0.2 billion to $20.8 billion.
Year-to-date, the goods and services deficit increased $6.9 billion, or 1.3 percent, from the same period in 2018. Exports decreased $0.8 billion or less than 0.1 percent. Imports increased $6.1 billion or 0.2 percent.
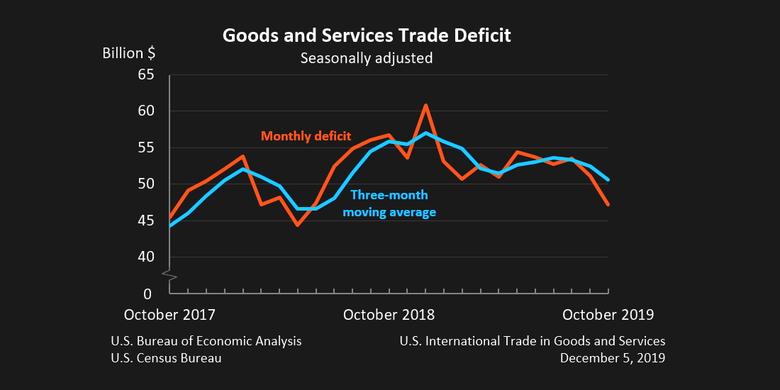
Three-Month Moving Averages (exhibit 2)
The average goods and services deficit decreased $1.8 billion to $50.6 billion for the three months ending in October.
- Average exports decreased $0.6 billion to $208.0 billion in October.
- Average imports decreased $2.4 billion to $258.6 billion in October.
Year-over-year, the average goods and services deficit decreased $5.3 billion from the three months ending in October 2018.
- Average exports decreased $1.2 billion from October 2018.
- Average imports decreased $6.5 billion from October 2018.
Exports (exhibits 3, 6, and 7)
Exports of goods decreased $0.8 billion to $136.1 billion in October.
Exports of goods on a Census basis decreased $0.7 billion.
- Consumer goods decreased $0.7 billion.
- Pharmaceutical preparations decreased $0.4 billion.
- Gem diamonds decreased $0.4 billion.
- Capital goods decreased $0.4 billion.
- Civilian aircraft engines decreased $0.6 billion.
- Automotive vehicles, parts, and engines decreased $0.3 billion.
- Industrial supplies and materials increased $0.6 billion.
Net balance of payments adjustments decreased $0.1 billion.
Exports of services increased $0.3 billion to $71.1 billion in October.
- Other business services increased $0.2 billion.
- Travel increased $0.1 billion.
- Transport decreased $0.1 billion.
Imports (exhibits 4, 6, and 8)
Imports of goods decreased $4.5 billion to $204.1 billion in October.
Imports of goods on a Census basis decreased $4.6 billion.
- Consumer goods decreased $2.4 billion.
- Pharmaceutical preparations decreased $0.8 billion.
- Cell phones and other household goods decreased $0.4 billion.
- Cotton apparel and household goods decreased $0.3 billion.
- Toys, games, and sporting goods decreased $0.3 billion.
- Automotive vehicles, parts, and engines decreased $1.8 billion.
- Automotive parts and accessories decreased $0.8 billion.
- Passenger cars decreased $0.5 billion.
- Trucks, buses, and special purpose vehicles decreased $0.5 billion.
Net balance of payments adjustments increased $0.1 billion.
Imports of services increased $0.1 billion to $50.2 billion in October.
- Travel increased $0.1 billion.
- Other business services increased $0.1 billion.
- Transport decreased $0.1 billion.
Real Goods in 2012 Dollars – Census Basis (exhibit 11)
The real goods deficit decreased $3.9 billion to $79.1 billion in October.
- Real exports of goods decreased $0.8 billion to $147.8 billion.
- Real imports of goods decreased $4.7 billion to $226.9 billion.
Revisions
Exports and imports of goods and services were revised for April through September 2019 to incorporate more comprehensive and updated quarterly and monthly data.
Revisions to September exports
- Exports of goods were revised down less than $0.1 billion.
- Exports of services were revised up $1.6 billion.
Revisions to September imports
- Imports of goods were revised down less than $0.1 billion.
- Imports of services were revised up $0.2 billion.
Goods by Selected Countries and Areas: Monthly – Census Basis (exhibit 19)
The October figures show surpluses, in billions of dollars, with South and Central America ($4.7), OPEC ($1.9), Hong Kong ($1.8), Brazil ($1.2), United Kingdom ($0.8), Singapore ($0.6), and Saudi Arabia ($0.6). Deficits were recorded, in billions of dollars, with China ($27.8), European Union ($14.3), Mexico ($7.8), Germany ($5.0), Japan ($4.5), Canada ($3.4), Italy ($2.6), France ($2.0), India ($2.0), Taiwan ($1.6), and South Korea ($1.5).
- The deficit with Japan decreased $1.4 billion to $4.5 billion in October. Exports increased $0.6 billion to $6.4 billion and imports decreased $0.9 billion to $10.9 billion.
- The deficit with the European Union decreased $1.3 billion to $14.3 billion in October. Exports increased $0.5 billion to $28.7 billion and imports decreased $0.9 billion to $43.0 billion.
- The deficit with Canada increased $0.8 billion to $3.4 billion in October. Exports decreased $0.7 billion to $23.8 billion and imports increased $0.2 billion to $27.2 billion.
Goods and Services by Selected Countries and Areas: Quarterly – Balance of Payments Basis (exhibit 20)
Statistics on trade in goods and services by country and area are only available quarterly, with a one-month lag. With this release, third-quarter figures are now available.
The third-quarter figures show surpluses, in billions of dollars, with South and Central America ($21.6), Brazil ($8.0), Hong Kong ($7.6), OPEC ($6.5), Singapore ($4.9), United Kingdom ($4.6), and Saudi Arabia ($2.1). Deficits were recorded, in billions of dollars, with China ($77.3), European Union ($34.3), Mexico ($26.3), Germany ($18.3), Japan ($14.9), Italy ($9.8), India ($7.5), Taiwan ($5.4), France ($4.7), South Korea ($2.3), and Canada ($2.0).
- The deficit with China decreased $2.6 billion to $77.3 billion in the third quarter. Exports increased less than $0.1 billion to $42.5 billion and imports decreased $2.6 billion to $119.8 billion.
- The surplus with members of OPEC increased $2.1 billion to $6.5 billion in the third quarter. Exports decreased $0.1 billion to $19.8 billion and imports decreased $2.2 billion to $13.3 billion.
- The deficit with Germany increased $1.8 billion to $18.3 billion in the third quarter. Exports increased $0.7 billion to $24.3 billion and imports increased $2.6 billion to $42.6 billion.
-----
Earlier:

2019, November, 29, 15:15:00
U.S. GDP UP 2.1%
U.S. Real gross domestic product (GDP) increased at an annual rate of 2.1 percent in the third quarter of 2019 (table 1), according to the "second" estimate released by the Bureau of Economic Analysis. In the second quarter, real GDP increased 2.0 percent.
2019, November, 18, 12:40:00
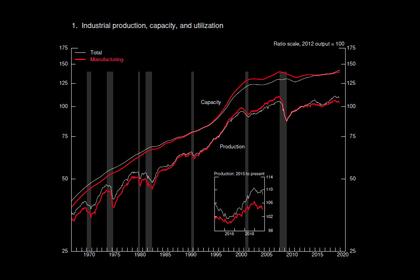
U.S. INDUSTRIAL PRODUCTION DOWN 0.8%
U.S. Industrial production fell 0.8 percent in October after declining 0.3 percent in September. Manufacturing production decreased 0.6 percent in October.


