2019-02-06 10:25:00


IMF: GLOBAL DEBT
IMF - Until recently, we had a partial view of global debt. Our new update to the IMF’s Global Debt Database, first made public in May 2018, now fills even more of the gaps. We have compiled data on public and private debt for 190 countries, dating back to 1950, which now includes the latest numbers for 2017.
We make these data free and publicly available for all to use because we believe transparency can help create better public policy.
The long view
In the past, we had detailed information about some bigger economies, such as the United States and Japan, but existing databases either covered a narrow measure of debt—for example, bank credit—for a broad sample of countries, or a comprehensive one for a few countries and years. By including both the government and private sides of borrowing for the entire world, the Global Debt Database offers an unprecedented picture of global debt in the post-World War II era. From all these data we have gathered a few new insights on debt:
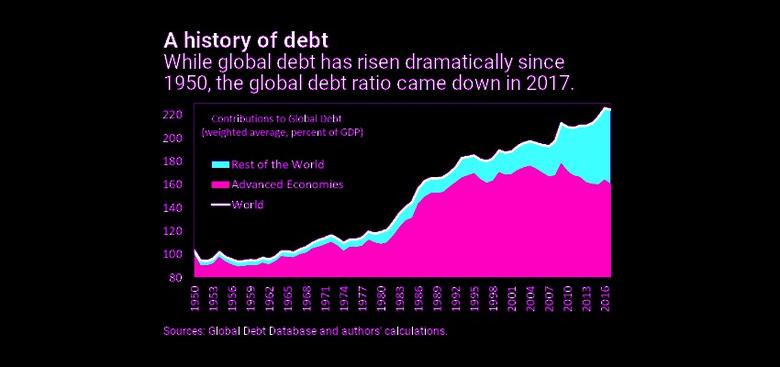
- Global debt has reached an all-time high of $184 trillion in nominal terms, the equivalent of 225 percent of GDP in 2017. On average, the world’s debt now exceeds $86,000 in per capita terms, which is more than 2½ times the average income per-capita.
- The most indebted economies in the world are also the richer ones. You can explore this more in the interactive chart below. The top three borrowers in the world—the United States, China, and Japan—account for more than half of global debt, exceeding their share of global output.
- The private sector’s debt has tripled since 1950. This makes it the driving force behind global debt. Another change since the global financial crisis has been the rise in private debt in emerging markets, led by China, overtaking advanced economies. At the other end of the spectrum, private debt has remained very low in low-income developing countries.
- Global public debt, on the other hand, has experienced a reversal of sorts. After a steady decline up to the mid-1970s, public debt has gone up since, with advanced economies at the helm and, of late, followed by emerging and low-income developing countries.
Was 2017 different?
For 2017, the signals are mixed. Compared to the previous peak in 2009, the world is now more than 11 percentage points of GDP deeper in debt. Nonetheless, in 2017 the global debt ratio fell by close to 1½ percent of GDP compared to a year earlier. The last time the world witnessed a similar decline was in 2010, although it proved short-lived. However, it is not yet clear whether this is a hiatus in an otherwise uninterrupted ascending trend or if countries have begun a longer process to shed more debt. New country data available later in 2019 will tell us more about the global debt picture. For 2017, we divided up countries into three groups based on their debt profile and here’s what we found:
- Advanced economies: There has been a retrenchment in debt build-up among advanced economies. Private debt, although marginally on the rise, is well below its peak. Also, public debt in advanced economies experienced a healthy decline of close to 2½ percent of GDP in 2017. To find a similar reduction in public debt we need to go back a decade, when global growth was some 1¾ percentage points higher than today.
- Emerging market economies: These countries continued to borrow in 2017, although at a much slower rate. A major shift occurred in China where the pace of private debt accumulation, although still high, decelerated significantly.
- Low-income developing countries: Public debt continued to grow in 2017 and, in some cases, reached levels close to those seen when countries sought debt relief.
Overall, the picture of global debt has changed as the world has changed. The data shows that a big part of the decline in the global debt ratio is the result of the waning importance of heavily-indebted advanced economies in the world economy.
With financial conditions tightening in many countries, which includes rising interest rates, prospects for bringing debt down remain uncertain. The high levels of corporate and government debt built up over years of easy global financial conditions, which the Fiscal Monitor documents, constitute a potential fault line.
So, as we close the first decade after the global financial crisis, the legacy of excessive debt still looms large.
In April 2019 we will release our next Fiscal Monitor with the latest facts about public finances, including debt, which will help shed some new light and offer policy advice for countries.
Debt Around the World
Of the global total of $184 trillion in debt at the end of 2017, close to two-thirds is nonfinancial private debt and the remainder is public debt. The chart allows you to explore some of the differences between countries.

-----
Earlier:

2018, September, 19, 13:15:00
IMF: NORWAY IS BETTERIMF - Norway is in the midst of a healthy recovery from the oil downturn, supported by positive trends in oil prices and a strengthening labor market. In addition, banks remain profitable and well capitalized. However, household debt continues to increase and house prices have resumed their rise, especially in the Oslo area, after a correction during 2017. |

2018, September, 19, 13:10:00
IMF: BRITAIN'S ECONOMIC CHALLENGESIMF - Beyond Brexit, the UK faces a range of other economic challenges. These include persistently lackluster productivity growth, large public debt, and the wide current account deficit. The UK’s sound macroeconomic framework, regulatory environment, and deep capital and flexible labor markets will be advantages in implementing reforms to address them. |

2018, August, 29, 10:20:00
UKRAINE'S DEBT WILL UPUNIAN - "If we don't pay, this will mean inflation, uncontrolled price rises for everything, depreciation of the national currency, halt of industrial production, and so on... And that's why we are adopting a strategy to manage the debt so as to protect people from any negative consequences as much as possible. We spend UAH 130 billion annually on debt servicing alone," Groysman said. |

2018, August, 6, 13:05:00
HUNGARY'S GROWTH 4%IMF - Hungary has achieved several years of strong growth and substantially reduced its external debt. Growth is expected to be around 4 percent in 2018, similar to last year. This strong expansion has been supported by private consumption and EU funds-related investments. |

2018, August, 3, 09:15:00
SOUTH AFRICA: NEGATIVE GROWTHIMF - Amid a marked growth deceleration, some of South Africa’s economic and social achievements after the end of apartheid have recently unwound. While the economy is globally positioned, sophisticated, and diversified, gaps in physical infrastructure and education create large productivity differentials across sectors. Low consumer and business confidence has dampened productivity growth. Fast growing debt has constrained policy space. As a result, per-capita growth has turned negative, the poverty rate stands at around 40 percent, unemployment has crept up to 27 percent—almost twice that level for the youth—and income inequality is one of the highest globally. |

2018, July, 16, 10:15:00
BRAZIL'S GDP UP 1.8%IMF - Following the severe recession in 2015−16, real GDP grew by 1 percent in 2017. Growth is projected to be 1.8 and 2.5 percent in 2018 and 2019, respectively, driven by a recovery in domestic consumption and investment. Even if federal expenditure remains constant in real terms at its 2016 level, as mandated by a constitutional rule, public debt is expected to rise further and peak in 2023 at above 90 percent of GDP. |

2018, May, 30, 13:55:00
GLOBAL INVESTMENT UP, DEBT DOWNEIA - Financial Review of the Global Oil and Natural Gas Industry: 2017 - Brent crude oil daily average prices were $54.75 per barrel in 2017—21% higher than 2016 levels - Excluding proved reserve acquisitions, upstream costs incurred increased from 2016 levels but remained lower than 2008–15 levels - Proved reserves additions in 2017 approached the highest levels in the 2008–17 period - Finding plus lifting costs fell to $29 dollars per barrel of oil equivalent in 2017, the lowest level in the 2008–17 period - The energy companies reduced debt in 2017, the first year in the 2008–17 period - Refiners with global refining assets reduced distillation capacity for the eighth consecutive year |


