2019-02-13 11:35:00


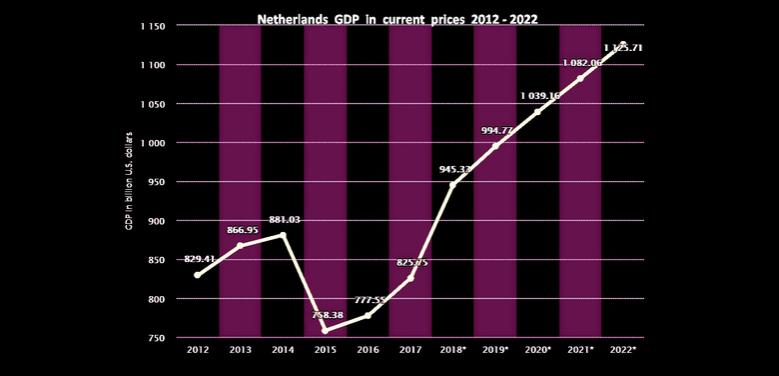
NETHERLANDS GDP UP 2.6%

IMF - On February 8, 2019, the Executive Board of the International Monetary Fund (IMF) concluded the Article IV consultation with the Netherlands. [1]
The Dutch economy has performed very well in recent years. Growth is estimated at 2.6 percent in the 2018, owing to strong domestic demand and robust net exports. Domestic consumption was supported by favorable labor market developments, expansionary fiscal policy, and a booming housing market. The large trade surplus contributed to the still high current account surplus, estimated at 9.8 percent of GDP in 2018. The unemployment rate reached a decade low although real wages and inflation remain subdued. Households and corporations are still deleveraging, and credit growth remains negative. Banks capitalization improved, and non-performing loans are among the lowest in the euro area.
The economy will continue to expand, but at a lower growth rate. Strong domestic demand will support growth in the near term as global trade slows down. However, in the medium- and longer-term, unfavorable demographic developments and weak productivity growth will weigh on potential growth. Inflation and wages are projected to pick up gradually owing to continued tightening labor market and increased basic VAT. Fiscal policy will remain supportive and public debt is projected to decline further.
Risks to the outlook are titled to the downside. Rising global protectionism and treats to global demand, uncertainties surrounding fiscal policies in other euro area countries, and a possible no-agreement Brexit could negatively affect the Dutch economy through exports and investment. In addition, a sharp tightening of global financial conditions could weigh on the financial positions of still highly leveraged households that have large balance sheets which contributes to increased volatility of the economy and reduced consumption, and could lead to heightened stress in banks due to their heavy reliance on wholesale funding.
Executive Board Assessment [2]
Executive Directors commended the authorities for the sound macroeconomic management and welcomed the Netherlands’ robust economic performance that is increasingly driven by domestic demand. Growth rates have been above the euro area average, the fiscal position is strong, unemployment is low, and the banking sector is healthy overall. However, Directors noted that structural imbalances in the household and corporate sectors and uncertainties in the global environment, including from rising global protectionism and spillovers from a disorderly Brexit, weigh on potential growth in the medium term. Directors recommended that policy priorities should focus on addressing the imbalances, including through boosting household disposable income and reducing household debt, and strengthening the small and medium‑sized enterprises (SMEs) sector to help long‑term growth and build resilience to shocks. Policies to reduce the imbalances would also help reduce the large current account surplus.
Directors commended the authorities’ policy to use the economic upswing to build fiscal buffers. Noting the available fiscal space, many Directors recommended using this opportunity to further reduce labor taxation and increase spending on priorities such as human capital and research and development (R&D). This would help support potential growth and rebalancing without jeopardizing long‑term fiscal sustainability. At the same time, many Directors sympathized with the authorities’ cautious fiscal framework and saw merit in preserving some fiscal space as a buffer to deal with potential adverse shocks, given that the Dutch economy is relatively exposed to external risks.
Directors encouraged higher wage growth to boost households’ disposable income and welcomed the authorities’ planned decrease in the labor tax wedge. They emphasized that labor market duality should be reduced, as part‑time workers and the self‑employed have on average lower wages. Directors agreed that a pension system reform that provides more choice could help reduce the prevalence of self‑employment, thereby supporting higher wages.
Directors encouraged efforts to improve housing affordability and reduce household indebtedness. They supported the authorities’ plan to lower the mortgage interest deductibility to reduce mortgage debt bias for households. In addition, they recommended further tightening of macroprudential policies, including loan‑to value and debt‑service‑to‑income ratios. Directors encouraged the authorities to further liberalize rent controls, improve mean‑testing for social housing, and simplify procedures for building permits, to help boost supply of housing and further reduce household mortgage debt. Directors welcomed ongoing efforts to improve coordination among main stakeholders involved in this process.
Directors recommended policies to support SMEs and boost investment, including expending direct public support to R&D. They welcomed the steps being taken to increase access to finance for SMEs and saw merit in establishing a credit bureau that would help improve availability of information and facilitate access to finance.
Directors observed that banking sector soundness and profitability have improved. However, noting that banks remain highly leveraged, concentrated, and vulnerable to shocks, they encouraged the authorities to continue to build buffers and further strengthen supervision. Given the Netherlands’ position as a financial and corporate center, Directors considered that maintaining a strong AML/CFT framework will be essential for effective banking supervision.
Netherlands: Selected Economic Indicators, 2017–2020
|
2017 |
2018 |
2019 |
2020 |
|||
|
Est. |
Proj. |
Proj. |
||||
|
National accounts (percent change) |
||||||
|
Gross domestic product |
2.9 |
2.6 |
2.2 |
2.1 |
||
|
Private consumption |
1.9 |
2.4 |
2.4 |
2.4 |
||
|
Public consumption |
1.1 |
1.4 |
1.8 |
2.0 |
||
|
Gross fixed investment |
6.1 |
4.9 |
4.7 |
4.5 |
||
|
Total domestic demand |
2.2 |
2.7 |
2.8 |
2.8 |
||
|
Exports of goods and nonfactor services |
5.4 |
5.1 |
4.4 |
3.9 |
||
|
Imports of goods and nonfactor services |
4.9 |
5.5 |
5.3 |
4.9 |
||
|
Net foreign balance¹ |
0.9 |
0.2 |
-0.3 |
-0.4 |
||
|
Output gap (percent of potential output) |
-0.1 |
0.7 |
1.2 |
1.2 |
||
|
Prices, wages, and employment |
||||||
|
Consumer price index (HICP) |
1.3 |
1.6 |
2.4 |
2.0 |
||
|
GDP deflator |
1.2 |
1.9 |
2.3 |
1.9 |
||
|
Hourly compensation (manufacturing) |
2.3 |
2.5 |
2.8 |
3.0 |
||
|
Unit labor costs (manufacturing) |
-1.5 |
0.0 |
0.1 |
0.4 |
||
|
Employment (percent) |
||||||
|
Unemployment rate (national definition) |
5.9 |
… |
… |
… |
||
|
Unemployment rate (ILO definition) |
4.9 |
3.9 |
3.8 |
3.7 |
||
|
NAIRU |
5.3 |
5.2 |
5.2 |
5.2 |
||
|
External trade |
||||||
|
Merchandise balance (percent of GDP) |
9.6 |
9.1 |
8.6 |
8.0 |
||
|
Current account balance (percent of GDP) |
10.5 |
9.8 |
9.5 |
8.9 |
||
|
General government accounts (percent of GDP) |
||||||
|
Revenue |
43.7 |
43.6 |
44.0 |
43.6 |
||
|
Expenditure |
42.6 |
42.5 |
43.0 |
42.8 |
||
|
Net lending/borrowing |
1.2 |
1.1 |
1.0 |
0.8 |
||
|
Primary balance |
2.1 |
1.8 |
1.6 |
1.4 |
||
|
Structural balance² |
1.2 |
0.5 |
-0.1 |
0.0 |
||
|
Structural primary balance² |
2.4 |
1.5 |
0.7 |
0.8 |
||
|
General government gross debt |
57.0 |
54.6 |
51.6 |
49.1 |
||
|
Sources: Dutch official publications, IMF, IFS, and IMF staff calculations. |
||||||
|
¹ Contribution to GDP growth. |
||||||
|
² In percent of potential GDP. |
||||||
[1] Under Article IV of the IMF's Articles of Agreement, the IMF holds bilateral discussions with members, usually every year. A staff team visits the country, collects economic and financial information, and discusses with officials the country's economic developments and policies. On return to headquarters, the staff prepares a report, which forms the basis for discussion by the Executive Board.
[2] At the conclusion of the discussion, the Managing Director, as Chairman of the Board, summarizes the views of Executive Directors, and this summary is transmitted to the country's authorities. An explanation of any qualifiers used in summings up can be found here:http://www.imf.org/external/np/sec/misc/qualifiers.htm.
-----
Earlier:

2018, December, 5, 09:35:00
GRONINGEN GAS PRODUCTION WILL DOWN BY 75%REUTERS - Gas production at the earthquake-prone Groningen field will drop by at least 75 percent in the next five years, ahead of schedule towards the projected end of extraction. |

2015, June, 12, 20:45:00
RUSSIA & NETHERLANDS GAS DOWNGlobal trade of natural gas via pipelines fell the most on record last year as Russia halted exports to Ukraine and shipments declined from the Netherlands, the European Union’s biggest producer, according to BP. |

2015, June, 8, 19:00:00
EU GAS IS WORSENot quite as severe as in the UK, he says the trend is similar in the Netherlands, considering the decline in Groningen and the curtail in production: “Moving from a net exporter of gas to a net importer of gas.” The situation across the entire EU, according to Mr. Egan, is even worse, with the European Union importing 80% of its gas, forecast to get even worse. |

2015, March, 12, 20:45:00
DUTCH QUAKESTowns in the northern province of Groningen sit atop the continent’s biggest gas field, where the Dutch government says exploration by Royal Dutch Shell Plc and Exxon Mobil Corp. has triggered 196 earthquakes since 2013, damaging buildings and making home sales difficult. Lawmakers, seeking support in provincial elections March 18, have responded to residents’ complaints with a proposed cut in gas production, the second since December, in the hope that less output means fewer tremors. |

2014, August, 20, 18:30:00
DUTCH & RUSSIA: FROM $974 MLN TO $26 BLNDutch review energy ties with Russia after MH17 crash |


