NOV VARCO NET LOSS $31 MLN

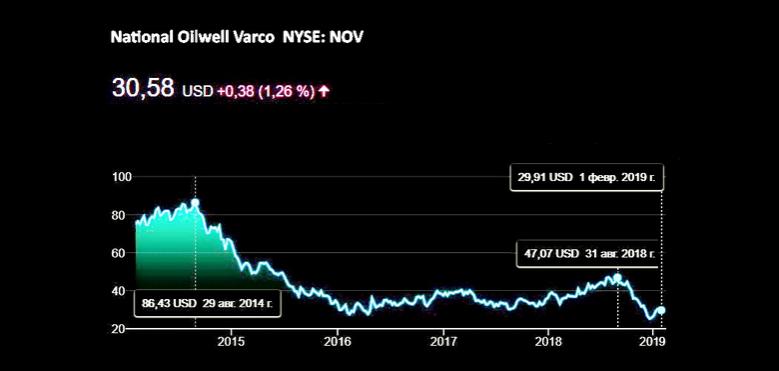
NOV - National Oilwell Varco, Inc. (NYSE: NOV) reported fourth quarter 2018 revenues of $2.40 billion, an increase of 11 percent compared to the third quarter of 2018 and an increase of 22 percent from the fourth quarter of 2017. Operating profit for the fourth quarter of 2018 was $87 million, or 3.6 percent of sales, Adjusted EBITDA (operating profit excluding depreciation, amortization, and other items) was $279 million, or 11.6 percent of sales, and net income was $12 million. Operating profit increased 19 percent sequentially, and Adjusted EBITDA increased 14 percent sequentially and 42 percent compared to the fourth quarter of 2017. Other items totaled $21 million, pre-tax, and were primarily related to charges associated with the closure of one of the Company’s facilities.
Revenues for the full year 2018 were $8.45 billion, operating profit was $211 million, and net loss was $31 million, or $0.08 per share. Adjusted EBITDA for the full year was $910 million, or 10.8 percent of sales.
"During 2018 our team delivered outstanding execution in a volatile operating environment by focusing on our customers' need for solutions that improve their operating efficiencies," commented Clay Williams, Chairman, President, and CEO. "Each of our operating segments delivered double-digit percent revenue increases in 2018, contributing to a 16 percent increase in consolidated company revenue and a 49 percent increase in Adjusted EBITDA, year-over-year."
"The sharp, fourth quarter pull-back in commodity prices heightened uncertainty surrounding 2019 capital budgets and led to an abrupt slowdown in orders, while some of our customers chose to accelerate deliveries prior to year-end. We anticipate that lower orders in December, combined with equipment sales that were pulled forward near year-end, will lead to lower sequential revenue during the first quarter 2019 in all three segments. However, encouraged by the recent uptick in oil prices, some of our customers have recently signaled their intent to increase activity, particularly in certain international and offshore markets. While the near-term outlook remains uncertain, NOV's portfolio of critical technologies to support the oil and gas industry, together with our track record of adapting quickly to changing market conditions, positions us well for any market environment."
|
NATIONAL OILWELL VARCO, INC. CONSOLIDATED STATEMENTS OF INCOME (LOSS) (Unaudited) (In $ millions, except per share data) |
|||||
| Three Months Ended | Years Ended | ||||
| December 31, | September 30, | December 31, | |||
| 2018 | 2017 | 2018 | 2018 | 2017 | |
| Revenue: | |||||
| Wellbore Technologies | 884 | 715 | 847 | 3,235 | 2,577 |
| Completion & Production Solutions | 788 | 690 | 735 | 2,931 | 2,672 |
| Rig Technologies | 804 | 614 | 637 | 2,575 | 2,252 |
| Eliminations | (78) | (50) | (65) | (288) | (197) |
| Total revenue | 2,398 | 1,969 | 2,154 | 8,453 | 7,304 |
| Gross profit | 409 | 167 | 393 | 1,444 | 892 |
| Gross profit % | 17.1 | 8.5 | 18.2 | 17.1 | 12.2 |
| Selling, general, and administrative | 322 | 278 | 320 | 1,233 | 1,169 |
| Operating profit (loss) | 87 | (111) | 73 | 211 | (277) |
| Interest and financial costs | (22) | (25) | (24) | (93) | (102) |
| Interest income | 7 | 6 | 6 | 25 | 25 |
| Equity loss in unconsolidated affiliates | (2) | (1) | (2) | (3) | (5) |
| Other income (expense), net | (29) | (7) | (20) | (99) | (43) |
| Income (loss) before income taxes | 41 | (138) | 33 | 41 | (402) |
| Provision (benefit) for income taxes | 26 | (123) | 29 | 63 | (166) |
| Net income (loss) | 15 | (15) | 4 | (22) | (236) |
| Net (income) loss attributable to noncontrolling interests | 3 | (1) | 3 | 9 | 1 |
| Net income (loss) attributable to Company | 12 | (14) | 1 | (31) | (237) |
| Per share data: | |||||
| Basic | 0.03 | (0.04) | 0.00 | (0.08) | (0.63) |
| Diluted | 0.03 | (0.04) | 0.00 | (0.08) | (0.63) |
| Weighted average shares outstanding: | |||||
| Basic | 379 | 377 | 379 | 378 | 377 |
| Diluted | 383 | 377 | 383 | 378 | 377 |
|
NATIONAL OILWELL VARCO, INC. CONSOLIDATED BALANCE SHEETS (Unaudited) (In $ millions) |
||
| December 31, | ||
| 2018 | 2017 | |
| Cash and cash equivalents | 1,427 | 1,437 |
| Receivables, net | 2,101 | 2,015 |
| Inventories, net | 2,986 | 3,003 |
| Contract assets | 565 | 495 |
| Other current assets | 200 | 267 |
| Total current assets | 7,279 | 7,217 |
| Property, plant and equipment, net | 2,797 | 3,002 |
| Goodwill and intangibles, net | 9,284 | 9,528 |
| Other assets | 436 | 459 |
| Total assets | 19,796 | 20,206 |
| LIABILITIES AND STOCKHOLDERS’ EQUITY | ||
| Current liabilities: | ||
| Accounts payable | 722 | 510 |
| Accrued liabilities | 1,088 | 1,238 |
| Contract liabilities | 458 | 519 |
| Current portion of long-term debt and short-term borrowings | 7 | 6 |
| Accrued income taxes | 66 | 81 |
| Total current liabilities | 2,341 | 2,354 |
| Long-term debt | 2,704 | 2,706 |
| Other liabilities | 862 | 986 |
| Total liabilities | 5,907 | 6,046 |
| Total stockholders’ equity | 13,889 | 14,160 |
| Total liabilities and stockholders’ equity | 19,796 | 20,206 |
|
NATIONAL OILWELL VARCO, INC. CONSOLIDATED STATEMENTS OF CASH FLOWS (Unaudited) (In $ millions) |
||
| Years Ended | ||
| December 31, | ||
| 2018 | 2017 | |
| Cash flows from operating activities: | ||
| Net loss | (22) | (236) |
| Adjustments to reconcile net loss to net cash provided by operating activities: | ||
| Depreciation and amortization | 690 | 698 |
| Working capital and other operating items, net | (147) | 370 |
| Net cash provided by operating activities | 521 | 832 |
| Cash flows from investing activities: | ||
| Purchases of property, plant and equipment | (244) | (192) |
| Business acquisitions, net of cash acquired | (280) | (86) |
| Other | 67 | 33 |
| Net cash used in investing activities | (457) | (245) |
| Cash flows from financing activities: | ||
| Payments against lines of credit and other debt | (8) | (506) |
| Cash dividends paid | (76) | (76) |
| Other | 54 | (13) |
| Net cash used in financing activities | (30) | (595) |
| Effect of exchange rates on cash | (44) | 37 |
| Increase (decrease) in cash and cash equivalents | (10) | 29 |
| Cash and cash equivalents, beginning of period | 1,437 | 1,408 |
| Cash and cash equivalents, end of period | 1,427 | 1,437 |
-----
Earlier:

2018, November, 7, 10:40:00
VARCO BUYS $500 MLNNOV VARCO - National Oilwell Varco, Inc. (NYSE: NOV) announced that its Board of Directors has authorized a share repurchase program to purchase up to $500 million of the Company's outstanding common stock. |

2018, October, 26, 12:01:00
NOV VARCO NET INCOME $1 MLNNOV VARCO - National Oilwell Varco, Inc. (NYSE: NOV) reported third quarter 2018 revenues of $2.15 billion, an increase of two percent compared to the second quarter of 2018 and an increase of 17 percent from the third quarter of 2017. Operating profit for the third quarter of 2018 was $73 million, or 3.4 percent of sales, Adjusted EBITDA (operating profit excluding depreciation and amortization) was $245 million, or 11.4 percent of sales, and net income was $1 million. |

2018, July, 27, 12:01:00
NOV VARCO NET INCOME $24 MLNNOV VARCO - National Oilwell Varco, Inc. (NYSE: NOV) reported second quarter 2018 net income of $24 million, or $0.06 per diluted share. Revenues for the second quarter were $2.11 billion, an increase of 17 percent compared to the first quarter of 2018 and an increase of 20 percent from the second quarter of 2017. Operating profit for the second quarter of 2018 was $52 million, or 2.5 percent of sales, and Adjusted EBITDA (operating profit excluding depreciation, amortization, and other items) was $226 million, or 10.7 percent of sales. |

2018, June, 29, 10:00:00
NOV - ARAMCO COOPERATIONNOV - National Oilwell Varco, Inc. (NYSE: NOV) today announced the signing of an agreement with Saudi Aramco to form a joint venture in the Kingdom of Saudi Arabia. Through its state-of-the-art manufacturing and fabrication facilities in the Kingdom and NOV’s market-leading drilling technologies, the joint venture will provide high-specification land rigs, rig and drilling equipment and offer certain aftermarket services. |

2018, April, 27, 10:30:00
NOV VARCO NET LOSS $68 MLNNOV - National Oilwell Varco, Inc. (NYSE: NOV) today reported a first quarter 2018 net loss of $68 million, or $0.18 per share. Revenues for the first quarter were $1.80 billion, a decrease of nine percent compared to the fourth quarter of 2017 and an increase of three percent from the first quarter of 2017. Operating loss for the first quarter of 2018 was $1 million, or 0.1 percent of sales, and Adjusted EBITDA (operating profit excluding depreciation, amortization, and other items) was $160 million, or 8.9 percent of sales. Other items were a net credit of $12 million, pre-tax, primarily from the reversal of certain accruals, partially offset by restructure charges and severance payments. |

2018, February, 7, 07:25:00
NOV VARCO NET LOSS $237 MLNNOV - National Oilwell Varco, Inc. (NYSE: NOV) reported a fourth quarter 2017 net loss of $14 million, or $0.04 per share. Revenues for the fourth quarter were $1.97 billion, an increase of seven percent compared to the third quarter and an increase of 16 percent from the fourth quarter of 2016. Operating loss for the fourth quarter was $111 million, or 5.6 percent of sales. Adjusted EBITDA (operating profit excluding depreciation, amortization, and other items) for the fourth quarter was $197 million, or 10.0 percent of sales, an increase of $30 million from the third quarter. Other items were $133 million, pre-tax, and primarily consisted of charges for inventory write-downs, facility closures and severance. Cash flow from operations for the fourth quarter was $321 million. |

2017, October, 27, 19:10:00
NOV VARCO NET LOSS $221 MLNNational Oilwell Varco, Inc. (NYSE: NOV) reported a third quarter 2017 net loss of $26 million, or $0.07 per share. Revenues for the third quarter of 2017 were $1.84 billion, an increase of four percent compared to the second quarter of 2017 and an increase of eleven percent from the third quarter of 2016. Operating loss for the third quarter was $7 million, or 0.4 percent of sales. Adjusted EBITDA (operating profit excluding other items before depreciation and amortization) for the third quarter was $167 million, or 9.1 percent of sales, an increase of $25 million from the second quarter of 2017. Cash flow from operations for the third quarter was $232 million. |


