2019-02-22 11:35:00
NOVATEK INCOME +4.7%
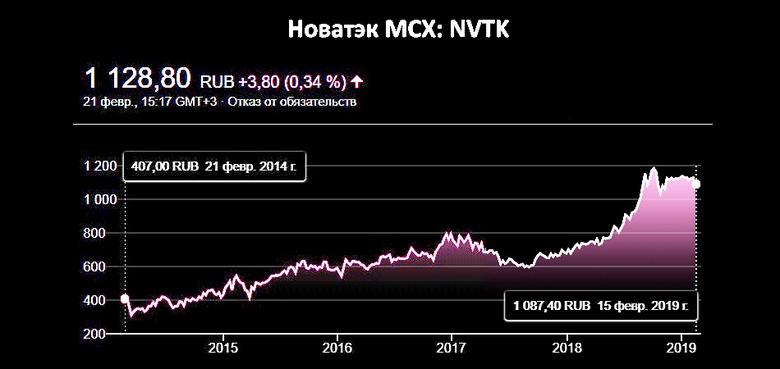
NOVATEK- PAO NOVATEK today released its audited consolidated financial statements for the year ended 31 December 2018 prepared in accordance with International Financial Reporting Standards (“IFRS”).
IFRS Financial Highlights
(in millions of Russian roubles except as stated)
(in millions of Russian roubles except as stated)
|
|
FY 2018
|
FY 2017
|
|
Oil and gas sales
|
825,761
|
579,819
|
|
Other revenues
|
5,997
|
3,367
|
|
Total revenues
|
831,758
|
583,186
|
|
Operating expenses
|
(603,912)
|
(419,859)
|
|
Net gain on disposal of interests in joint ventures
|
1,645
|
-
|
|
Other operating income (loss)
|
(2,307)
|
424
|
|
Normalized profit from operations*
|
225,539
|
163,751
|
|
Normalized EBITDA of subsidiaries*
|
259,370
|
198,335
|
|
Normalized EBITDA including share in EBITDA of joint ventures*
|
415,296
|
256,464
|
|
Finance income (expense)
|
38,608
|
14,658
|
|
Share of profit (loss) of joint ventures, net of income tax
|
(37,258)
|
22,430
|
|
Profit before income tax
|
228,534
|
200,839
|
|
Profit attributable to shareholders of PAO NOVATEK
|
163,742
|
156,387
|
|
Normalized profit attributable to shareholders of PAO NOVATEK **
|
232,930
|
156,166
|
|
Normalized basic and diluted earnings per share** (in Russian roubles)
|
77.29
|
51.78
|
* Excluding the effect from disposal of interests in joint ventures.
** Excluding the effects from the disposal of interests in joint ventures, as well as foreign exchange gains (losses).
In 2018, our total revenues amounted to RR 831.8 billion and Normalized EBITDA, including our share in EBITDA of joint ventures, totaled RR 415.3 billion, representing year-on-year increases of 42.6% and 61.9%, respectively. The increases in total revenues and Normalized EBITDA were largely due to production launch at the first three LNG trains at Yamal LNG and a favourable macro-economic environment with increases in average realized liquids and natural gas prices.
Profit attributable to shareholders of PAO NOVATEK increased to RR 163.7 billion (RR 54.33 per share), or by 4.7%, as compared to 2017. In 2018, our profit was significantly impacted by the recognition of substantial non-cash foreign exchange effects on foreign currency denominated loans of the Group and its joint ventures (the effect of foreign exchange differences in 2017 was less significant). Excluding the effect of foreign exchange differences, as well as the one-time effect from the disposal of interests in joint ventures, Normalized profit attributable to shareholders of PAO NOVATEK increased to RR 232.9 billion (RR 77.29 per share), or by 49.2%, as compared to 2017.
Hydrocarbon Production and Purchased Volumes
|
|
FY 2018
|
FY 2017
|
|
Total hydrocarbon production, million barrels of oil equivalent (million boe)
|
549.1
|
513.3
|
|
Total production (million boe per day)
|
1.50
|
1.41
|
|
Natural gas production including proportionate share in the production of joint ventures, million cubic meters (mmcm)
|
68,806
|
63,399
|
|
Natural gas production by subsidiaries
|
41,860
|
43,113
|
|
Natural gas purchases from joint ventures
|
24,892
|
15,297
|
|
Other purchases of natural gas
|
8,119
|
8,300
|
|
Total natural gas production by subsidiaries and purchases (mmcm)
|
74,871
|
66,710
|
|
Liquids production including proportionate share in the production of joint ventures, thousand tons (mt)
|
11,800
|
11,774
|
|
Liquids production by subsidiaries
|
6,546
|
6,759
|
|
Liquids purchases from joint ventures
|
9,368
|
9,315
|
|
Other purchases of liquids
|
226
|
173
|
|
Total liquids production by subsidiaries and purchases (mt)
|
16,140
|
16,247
|
Hydrocarbon Sales Volumes
|
|
FY 2018
|
FY 2017
|
|
Natural gas (mmcm)
|
72,134
|
65,004
|
|
including:
|
|
|
|
Sales in the Russian Federation
|
66,073
|
64,898
|
|
Sales on international markets
|
6,061
|
106
|
|
Liquids (mt)
|
15,822
|
15,939
|
|
including:
|
|
|
|
Stable gas condensate refined products
|
6,683
|
6,743
|
|
Crude oil
|
4,542
|
4,616
|
|
Liquefied petroleum gas
|
2,676
|
2,648
|
|
Stable gas condensate
|
1,908
|
1,918
|
|
Other oil products
|
13
|
14
|
Our operational results for 2018 were significantly impacted by the production launch at the first three LNG trains at Yamal LNG, as well as the acquisitions of new producing fields at the end of 2017 and in the first quarter of 2018 (the Beregovoye, the West-Yaroyakhinskoye and the Syskonsyninskoye fields). As a result, our total natural gas production increased by 8.5%, and our total liquids production changed marginally (increased by 0.2%).
In 2018, our natural gas sales volumes totaled 72.1 billion cubic meters (bcm), representing an 11.0% increase as compared to 2017, due to sales of LNG purchased primarily from our joint venture Yamal LNG to international markets and an increase in volumes sold in the Russian Federation. As at 31 December 2018, we recorded 2.2 bcm of natural gas in inventory balances relating mainly to natural gas in the Underground Gas Storage Facilities, compared to 1.0 bcm at 31 December 2017. Natural gas inventory balances tend to fluctuate period-to-period depending on the Group’s demand for natural gas withdrawal from the UGSF for the sale in the subsequent periods.
In 2018, our liquid hydrocarbons sales volumes aggregated 15.8 million tons, representing a marginal decrease by 0.7% as compared to 2017. As at 31 December 2018, we recorded 1,069 mt of liquid hydrocarbons in transit or storage and recognized as inventory as compared to 962 mt at 31 December 2017. Our liquid hydrocarbon inventory balances tend to fluctuate period-on-period and are usually realized in the following reporting period.
Selected Items of Consolidated Statement of Financial Position
(in millions of Russian roubles)
|
|
31 December 2018
|
31 December 2017
|
|
ASSETS
|
|
|
|
Non-current assets
|
923,050
|
890,726
|
|
Property, plant and equipment
|
408,201
|
360,051
|
|
Investments in joint ventures
|
244,500
|
285,326
|
|
Long-term loans and receivables
|
232,922
|
211,901
|
|
Current assets
|
293,320
|
153,436
|
|
Total assets
|
1,216,370
|
1,044,162
|
|
LIABILITIES AND EQUITY
|
|
|
|
Non-current liabilities
|
222,752
|
184,545
|
|
Long-term debt
|
170,043
|
141,448
|
|
Current liabilities
|
107,023
|
83,958
|
|
Total liabilities
|
329,775
|
268,503
|
|
Equity attributable to PAO NOVATEK shareholders
|
868,254
|
757,839
|
|
Non-controlling interest
|
18,341
|
17,820
|
|
Total equity
|
886,595
|
775,659
|
|
Total liabilities and equity
|
1,216,370
|
1,044,162
|
-----
Earlier:
2019, February, 20, 11:30:00
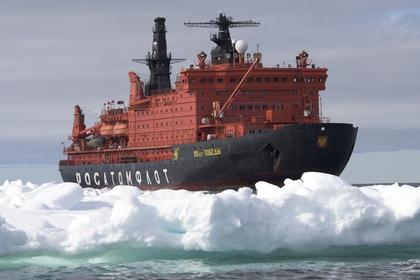
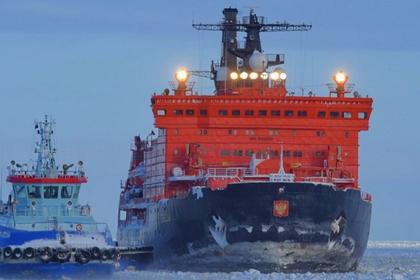
ИНВЕСТИЦИИ В РУССКУЮ АРКТИКУ
МИНЭНЕРГО РОССИИ - В будущем Россия вполне сможет обеспечить значительную часть растущих мировых потребностей в нефти и газе, в том числе за счет Арктической зоны, ресурсный потенциал которой составляет более 35 млрд тонн нефти и 210 трлн м3 газа.
2019, February, 15, 12:30:00
ИНВЕСТИЦИИ В РУССКУЮ ЭНЕРГИЮ
МИНЭНЕРГО РОССИИ - В ходе своего выступления Александр Новак отметил, что по объему инвестиций отрасли топливно-энергетического комплекса занимают лидирующие позиции в экономике России.«ТЭК играет важнейшую роль, является драйвером развития многих отраслей. Сегодня ТЭК формирует 25% ВВП и порядка 60% экспорта. Текущий объем инвестиций в ТЭК - 5 трлн рублей. Мы видим, что к 2024 году можем выйти на объем инвестиций в 7,5 трлн рублей. То есть фактически на 50% его увеличить», - сказал Министр.
2019, February, 4, 09:45:00
NOVATEK,SIEMENS COOPERATION
NOVATEK - PAO NOVATEK (“NOVATEK” and/or the “Company”) announced that Arctic LNG 2 (the “Project”) and Siemens signed a contract on compressor equipment for three liquefaction trains of the Project.
2019, January, 28, 10:30:00
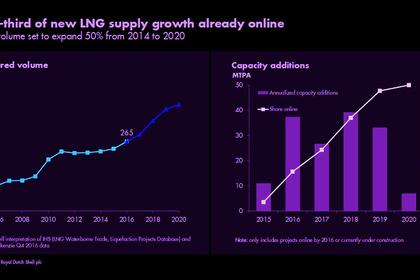
МИРОВОЙ РЫНОК СПГ: 600 МЛН. Т.
МИНЭНЕРГО РОССИИ - «С 2007 года количество стран-потребителей СПГ увеличилось с 17 до 40. В следующие 15 лет к ним присоединится ещё 15 стран. За то же время потребление СПГ выросло со 170 млн тонн до почти 300 млн тонн. Мы ожидаем, что к 2035 году потребление снова вырастет вдвое - уже до 600 млн тонн. При этом СПГ станет доминирующим в мировой торговле газом уже в течение ближайших пяти лет», - сказал Павел Сорокин.
2019, January, 25, 08:05:00
NOVATEK RESERVES: +4%
NOVATEK - Total SEC proved reserves, including the Company’s proportionate share in joint ventures, aggregated 15,789 million barrels of oil equivalent (boe), including 2,177 billion cubic meters (bcm) of natural gas and 181 million metric tons (mmt) of liquid hydrocarbons. Total proved reserves increased by 4% compared to the year-end 2017, representing a reserve replacement rate of 222% for the year, addition of 1,218 million boe, inclusive of 2018 production.
2019, January, 25, 08:00:00
NOVATEK'S GAS PRODUCTION: +10%
PLATTS - "We're increasing gas production by up to 10% taking into account Yamal LNG, with liquids output, including crude and condensate, to grow by around 2%, I think," Mikhelson was quoted as saying on the sidelines of the World Economic Forum in Davos.
2019, January, 18, 10:20:00
NOVATEK PRODUCTION +6.9%
NOVATEK - In 2018, NOVATEK’s hydrocarbon production totaled 548.4 million barrels of oil equivalent (boe), including 68.81 billion cubic meters (bcm) of natural gas and 11,800 thousand tons of liquids (gas condensate and crude oil), resulting in an increase in total hydrocarbons produced by 35.1 million boe, or by 6.9% as compared with the twelve months 2017.


