2019-02-08 11:20:00
U.S. DEFICIT $49.3 BLN
U.S. BEA - U.S. International Trade in Goods and Services, November 2018
The U.S. Census Bureau and the U.S. Bureau of Economic Analysis announced today that the goods and services deficit was $49.3 billion in November, down $6.4 billion from $55.7 billion in October, revised.

Exports, Imports, and Balance (exhibit 1)
November exports were $209.9 billion, $1.3 billion less than October exports. November imports were $259.2 billion, $7.7 billion less than October imports.
The November decrease in the goods and services deficit reflected a decrease in the goods deficit of $6.7 billion to $71.6 billion and a decrease in the services surplus of $0.3 billion to $22.3 billion.
Year-to-date, the goods and services deficit increased $51.9 billion, or 10.4 percent, from the same period in 2017. Exports increased $157.1 billion or 7.3 percent. Imports increased $208.9 billion or 7.9 percent.
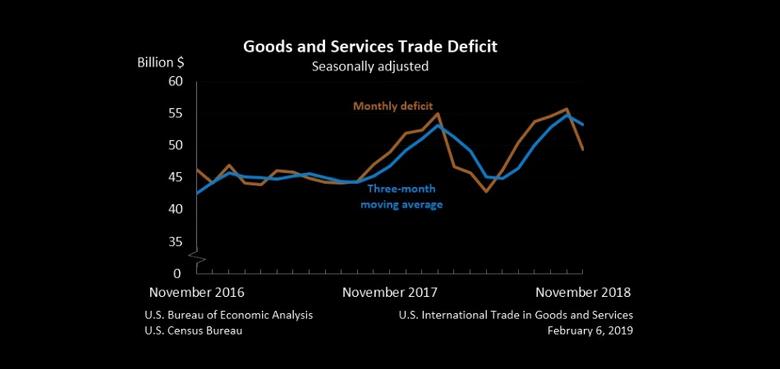
Three-Month Moving Averages (exhibit 2)
The average goods and services deficit decreased $1.5 billion to $53.2 billion for the three months ending in November.
- Average exports increased $0.5 billion to $210.8 billion in November.
- Average imports decreased $0.9 billion to $264.0 billion in November.
Year-over-year, the average goods and services deficit increased $6.4 billion from the three months ending in November 2017.
- Average exports increased $11.0 billion from November 2017.
- Average imports increased $17.5 billion from November 2017.
Exports (exhibits 3, 6, and 7)
Exports of goods decreased $1.2 billion to $140.3 billion in November.
Exports of goods on a Census basis decreased $1.2 billion.
- Industrial supplies and materials decreased $1.4 billion.
- Other petroleum products decreased $0.6 billion.
- Nonmonetary gold decreased $0.5 billion.
- Consumer goods decreased $0.9 billion.
- Gem diamonds decreased $0.5 billion.
- Pharmaceutical preparations decreased $0.4 billion.
- Capital goods increased $1.4 billion.
- Civilian aircraft increased $1.0 billion.
Net balance of payments adjustments increased less than $0.1 billion.
Exports of services decreased $0.1 billion to $69.5 billion in November.
- Financial services decreased $0.1 billion.
Imports (exhibits 4, 6, and 8)
Imports of goods decreased $7.9 billion to $211.9 billion in November.
Imports of goods on a Census basis decreased $7.9 billion.
- Consumer goods decreased $4.3 billion.
- Cell phones and other household goods decreased $2.3 billion.
- Artwork, antiques, stamps, and other collectibles decreased $0.4 billion.
- Industrial supplies and materials decreased $3.4 billion.
- Other petroleum products decreased $1.4 billion.
- Fuel oil decreased $0.8 billion.
- Crude oil decreased $0.7 billion.
Net balance of payments adjustments increased less than $0.1 billion.
Imports of services increased $0.2 billion to $47.3 billion in November.
- Travel (for all purposes including education) increased $0.3 billion.
- Insurance services decreased $0.1 billion.
Real Goods in 2012 Dollars – Census Basis (exhibit 11)
The real goods deficit decreased $7.5 billion to $80.8 billion in November.
- Real exports of goods increased $0.4 billion to $150.0 billion.
- Real imports of goods decreased $7.1 billion to $230.8 billion.
Revisions
Revisions to October exports
- Exports of goods were revised up less than $0.1 billion.
- Exports of services were revised up $0.1 billion.
Revisions to October imports
- Imports of goods were revised up $0.2 billion.
- Imports of services were revised up $0.2 billion.
Goods by Selected Countries and Areas: Monthly – Census Basis (exhibit 19)
The November figures show surpluses, in billions of dollars, with South and Central America ($4.8), Hong Kong ($2.6), United Kingdom ($0.9), Singapore ($0.8), and Brazil ($0.7). Deficits were recorded, in billions of dollars, with China ($35.4), European Union ($13.8), Mexico ($6.8), Japan ($5.7), Germany ($5.6), Italy ($2.7), South Korea ($1.9), India ($1.7), Taiwan ($1.6), Saudi Arabia ($1.5), France ($1.3), OPEC ($1.2), and Canada ($0.8).
- The deficit with China decreased $2.8 billion to $35.4 billion in November. Exports decreased $0.1 billion to $7.4 billion and imports decreased $2.9 billion to $42.8 billion.
- The deficit with Canada decreased $1.3 billion to $0.8 billion in November. Exports decreased $0.4 billion to $24.5 billion and imports decreased $1.7 billion to $25.3 billion.
- The deficit with Taiwan increased $0.4 billion to $1.6 billion in November. Exports decreased $0.3 billion to $2.5 billion and imports increased $0.1 billion to $4.1 billion.
-----
Earlier:

2019, February, 6, 10:25:00
IMF: GLOBAL DEBTIMF - Global debt has reached an all-time high of $184 trillion in nominal terms, the equivalent of 225 percent of GDP in 2017. On average, the world’s debt now exceeds $86,000 in per capita terms, which is more than 2½ times the average income per-capita. |

2019, February, 4, 09:30:00
U.S. UNEMPLOYMENT UP TO 4%U.S. BLS - Total nonfarm payroll employment increased by 304,000 in January, and the unemployment rate edged up to 4.0 percent, the U.S. Bureau of Labor Statistics reported. Job gains occurred in several industries, including leisure and hospitality, construction, health care, and transportation and warehousing. |

2019, February, 1, 10:55:00
U.S. FEDERAL FUNDS RATE 2.25-2.5%U.S. FRB - Consistent with its statutory mandate, the Committee seeks to foster maximum employment and price stability. In support of these goals, the Committee decided to maintain the target range for the federal funds rate at 2-1/4 to 2-1/2 percent. |

2019, January, 30, 11:05:00
U.S. GDP UP 3.2%U.S. DT - Over the first three quarters of 2018, the U.S. economy grew at an annualized rate of 3.2 percent, the fastest pace for the first three quarters of a year since 2005. Initial data for the fourth quarter indicate the economy continued to perform well, although slowing global growth and the housing sector could present headwinds. Private forecasters in the Blue Chip Economic Indicators monthly survey now estimate that real GDP growth slowed to 2.7 percent in the fourth quarter, and will slow further to 2.2 percent in the first quarter of 2019. |

2019, January, 7, 09:10:00
U.S. UNEMPLOYMENT UP TO 3.9%U.S. BLS - Total nonfarm payroll employment increased by 312,000 in December, and the unemployment rate rose to 3.9 percent, the U.S. Bureau of Labor Statistics reported today. Job gains occurred in health care, food services and drinking places, construction, manufacturing, and retail trade. |

2018, December, 24, 11:20:00
U.S. GDP UP 3.4%U.S. BEA - Real gross domestic product (GDP) increased at an annual rate of 3.4 percent in the third quarter of 2018, according to the "third" estimate released by the Bureau of Economic Analysis. In the second quarter, real GDP increased 4.2 percent. |

2018, December, 21, 14:15:00
U.S. DEFICIT UP TO $124.8 BLNU.S. BEA - The U.S. current-account deficit increased to $124.8 billion (preliminary) in the third quarter of 2018 from $101.2 billion (revised) in the second quarter of 2018, according to statistics released by the Bureau of Economic Analysis (BEA). The deficit was 2.4 percent of current-dollar gross domestic product (GDP) in the third quarter, up from 2.0 percent in the second quarter. |

