2019-02-01 11:10:00


U.S. GAS PRODUCTION UP 11.6%
EIA - Natural Gas Monthly November 2018
- In November 2018, for the 19th consecutive month, dry natural gas production increased year to year for the month. The preliminary level for dry natural gas production in November 2018 was 2,646 billion cubic feet (Bcf), or 88.2 Bcf/d. This level was 9.2 Bcf/d (11.6%) higher than the November 2017 level of 79.0 Bcf/d. The average daily rate of dry natural gas production for November was the highest for any month since EIA began tracking monthly dry natural gas production in 1973.
- The estimated natural gas consumption level in November 2018 was 2,678 Bcf, or 89.3 Bcf/d. This level was 13.9% (10.9 Bcf/d) higher than the 2,351 Bcf consumed in November 2017. Natural gas consumption for November was the highest level for the month since 2001, when EIA began using the current definitions for consuming sectors.
- Year-over-year total consumption of dry natural gas in November 2018 increased in all four consuming sectors. Deliveries of natural gas by consuming sector in November 2018 were:
Net natural gas imports (imports minus exports) were -123 Bcf, or -4.1 Bcf/d, in November 2018, making the United States a net exporter. Total imports were 7.1 Bcf/d, a decrease of 12.7% compared with 8.1 Bcf/d in November 2017. Total exports were 11.2 Bcf/d, an increase of 16.7% compared with 9.6 Bcf/d in November 2017. Natural gas exports were the highest for any month since EIA began tracking monthly exports in 1973. The increase in exports continues to be driven by liquefied natural gas (LNG). LNG exports in November 2018 were 35.0% higher than in November 2017. In November 2018, the United States exported 3.6 Bcf/d of LNG to 15 countries.- Residential deliveries: 591 Bcf, or 19.7 Bcf/d, which was up 26.3% compared with 15.6 Bcf/d in November 2017. Residential deliveries were the highest for the month since EIA began tracking residential deliveries in 1973
- Commercial deliveries: 380 Bcf, or 12.7 Bcf/d, which was up 18.0% compared with 10.7 Bcf/d in November 2017. Commercial deliveries were the highest for the month since EIA began tracking commercial deliveries in 1973.
- Industrial deliveries: 726 Bcf, or 24.2 Bcf/d, which was up 4.3% compared with 23.2 Bcf/d in November 2017. Industrial deliveries were the highest for the month since EIA began using the current definitions for consuming sectors in 2001. November was the 19th consecutive month that industrial deliveries set a new monthly high.
- Electric power deliveries: 754 Bcf, or 25.1 Bcf/d, which was up 13.7% compared with 22.1 Bcf/d in November 2017. Electric power deliveries were the highest for the month since 2001, when EIA began using the current definitions for consuming sectors.

-----
Earlier:

2019, January, 28, 10:30:00
МИРОВОЙ РЫНОК СПГ: 600 МЛН. Т.МИНЭНЕРГО РОССИИ - «С 2007 года количество стран-потребителей СПГ увеличилось с 17 до 40. В следующие 15 лет к ним присоединится ещё 15 стран. За то же время потребление СПГ выросло со 170 млн тонн до почти 300 млн тонн. Мы ожидаем, что к 2035 году потребление снова вырастет вдвое - уже до 600 млн тонн. При этом СПГ станет доминирующим в мировой торговле газом уже в течение ближайших пяти лет», - сказал Павел Сорокин. |

2019, January, 28, 10:05:00
U.S. ENERGY OUTLOOK 2019EIA - U.S. crude oil production continues to set annual records through the mid-2020s and remains greater than 14.0 million barrels per day (b/d) through 2040. The continued development of tight oil and shale gas resources, particularly those in the East and Southwest regions, supports growth in NGPL production—which reaches 6.0 million b/d by 2030—and dry natural gas production. Dry natural gas production reaches 43.4 trillion cubic feet by 2050. |

2019, January, 23, 11:20:00
U.S. PRODUCTION: OIL + 62 TBD, GAS + 849 MCFDU.S. EIA - Crude oil production from the major US onshore regions is forecast to increase 62,000 b/d month-over-month in February from 8,117 to 8,179 thousand barrels/day , gas production to increase 849 million cubic feet/day from 76,708 to 77,557 million cubic feet/day .
|

2019, January, 9, 11:05:00
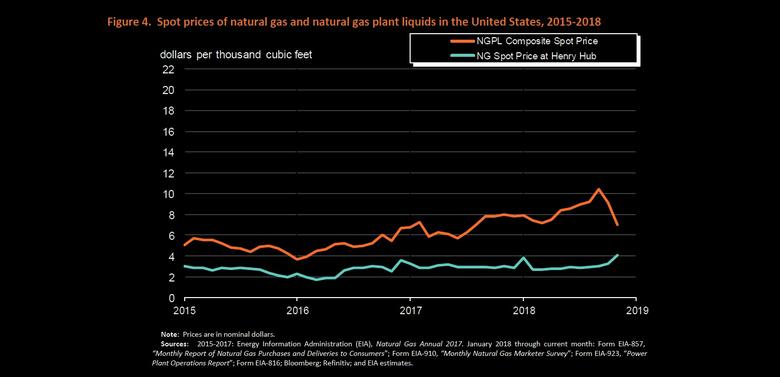
U.S. GAS UPEIA - In 2018, the average annual Henry Hub natural gas spot price increased to $3.16 per million British thermal units (MMBtu), up 15 cents from the 2017 average.
|

2018, December, 24, 12:00:00
U.S. PRIMARY ENERGY PRODUCTION 8.0 QUADRILLION BTUU.S. EIA - U.S. primary energy production totaled 8.0 quadrillion British thermal units (Btu), a 10% increase compared with September 2017.
|

2018, December, 21, 14:20:00
U.S. PRODUCTION: OIL + 134 TBD, GAS + 1,127 MCFDU.S. EIA - Crude oil production from the major US onshore regions is forecast to increase 134,000 b/d month-over-month in January from 8,032 to 8,166 thousand barrels/day , gas production to increase 1,127 million cubic feet/day from 75,789 to 76,916 million cubic feet/day .
|

2018, December, 12, 08:45:00
U.S. LNG WILL UPU.S. EIA - EIA projects that U.S. liquefied natural gas (LNG) export capacity will reach 8.9 billion cubic feet per day (Bcf/d) by the end of 2019, making it the third largest in the world behind Australia and Qatar. Currently, U.S. LNG export capacity stands at 3.6 Bcf/d, and it is expected to end the year at 4.9 Bcf/d as two new liquefaction units (called trains) become operational. |


