2019-02-08 11:45:00
U.S. GAS RECORD
U.S. EIA - Cold weather and a polar vortex blanketed much of the Lower 48 states from January 29–31, resulting in record natural gas consumption in the United States. Estimated total natural gas demand posted a new single-day record on January 30, topping the previous record set on January 1, 2018. Total estimated consumption by the power, industrial, and residential/commercial sectors and total estimated natural gas exports—by pipeline and as feedstock to liquefied natural gas (LNG) facilities—reached 145.9 billion cubic feet (Bcf) on January 30, compared with the previous record of 143.9 Bcf set in 2018, according to data from PointLogic Energy.
The polar vortex in the Midwest and Northeast led to temperatures much colder than normal. According to data from the National Oceanic and Atmospheric Administration (NOAA), daily temperatures in the Lower 48 states averaged 28° Fahrenheit (F) for the week ending January 31, which was 6°F lower than the 30-year average for the same period and 11°F lower than year-ago levels. The Midwest was the most heavily affected, with temperatures that were lower than normal by 25°F or more for three consecutive days.
Estimated use of natural gas by the residential and commercial sectors spiked to 70.9 Bcf on January 30, the third-largest residential and commercial daily consumption of natural gas on record, according to data from PointLogic Energy. The previous record was set on two days in January 2014 during another polar vortex event. This year, a handful of public utility companies in the Midwest issued notices asking industrial and residential/commercial customers to temporarily reduce natural gas consumption during the cold weather event. A fire at a natural gas compressor station in Southeastern Michigan (Macomb County) prompted Consumers Energy—Michigan's largest supplier of natural gas, serving 4.1 million customers—to ask residential and commercial customers to keep thermostats at or below 65°F when home and at 62°F when away from home. In response to Consumer Energy's public call, the auto industry halted operations at 18 Michigan plants; keeping an estimated 23,000 employees at home, according to the Washington Post. The requests were intended to alleviate constraints and ensure deliverability to critical infrastructures such as hospitals.
Natural gas trade was also affected during the cold weather event. Net Canadian imports of natural gas during the polar vortex averaged 7.2 billion cubic feet per day (Bcf/d) according to PointLogic Energy, an increase of 1.4 Bcf/d from levels in early January 2019. U.S. pipeline exports to Canada decreased, with some pipelines―the Empire pipeline in Western New York and the Great Lakes Transmission pipeline in Michigan―reversing flows and importing natural gas to serve U.S. population centers. The 1.75 Bcf/d Vector pipeline, which had been flowing at or near full capacity the week before the event, only exported 450 MMcf/d on average on both January 30 and 31 from the U.S. Midwest. Natural gas feedstock deliveries to liquefied natural gas (LNG) facilities also decreased by 1 Bcf/d in mid-January from 4.9 Bcf/d in the previous weeks; however, this was primarily in response to relatively mild winter weather in Asia and soft global spot LNG prices.
Some delivery day natural gas prices were affected by the weather, although price spikes were more muted than in previous cold weather events. Market hubs in the Midwest and Northeast began to see an increase in spot market prices the day before the polar vortex (January 28). Prices returned close to normal the day after the event (February 1). During this period, prices at the Henry Hub national benchmark averaged $2.89 per million British thermal units (MMBtu); Midwest regional prices averaged $3.63/MMBtu, with a high of $4.66/MMBtu for natural gas delivered on January 30; and Northeast regional prices averaged $6.95/MMBtu, with a high of $9.95/MMBtu for natural gas delivered on January 29. Prices at the Consumer Energy trading hub in Michigan were largely unaffected by the compressor station outage, averaging $3.15/MMBtu.
Overview: (For the week ending Wednesday, February 6, 2019)
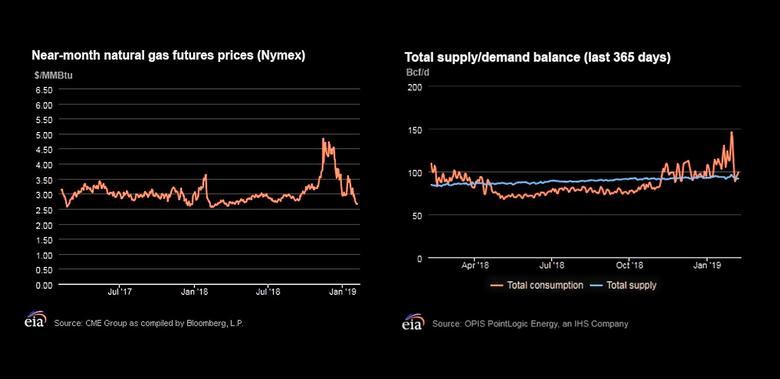
Natural gas spot prices fell in the Northeast and Midwest but rose on the West Coast and in the Rockies this report week (Wednesday, January 30 to Wednesday, February 6). Henry Hub spot prices fell from $2.96 per million British thermal units (MMBtu) last Wednesday to $2.56/MMBtu yesterday.
At the New York Mercantile Exchange (Nymex), the price of the March 2019 contract decreased 19¢, from $2.854/MMBtu last Wednesday to $2.662/MMBtu yesterday. The price of the 12-month strip averaging March 2019 through February 2020 futures contracts declined 13¢/MMBtu to $2.812/MMBtu.
Net withdrawals from working gas totaled 237 billion cubic feet (Bcf) for the week ending February 1. Working natural gas stocks are 1,960 Bcf, which is 6% lower than the year-ago level and 17% lower than the five-year (2014–18) average for this week.
The natural gas plant liquids composite price at Mont Belvieu, Texas, rose by 6¢/MMBtu, averaging $6.72/MMBtu for the week ending February 6. The price of natural gasoline, ethane, propane, butane, and isobutane all rose, by 8%, 2%, 3%, 2%, and 1%, respectively.
According to Baker Hughes, for the week ending Tuesday, January 29, the natural gas rig count increased by 1 to 198. The number of oil-directed rigs fell by 15 to 847. The total rig count decreased by 14, and it now stands at 1,045.
-----
Earlier:

2019, February, 4, 09:15:00
U.S. RIGS DOWN 14 TO 1,045BHGE - U.S. Rig Count is down 14 rigs from last week to 1,045 rigs, with oil rigs down 15 to 847 and gas rigs up 1 to 198. Canada Rig Count is up 11 rigs from last week to 243, with oil rigs up 13 to 159 and gas rigs down 2 to 84. |

2019, February, 1, 11:10:00
U.S. GAS PRODUCTION UP 11.6%EIA - In November 2018, for the 19th consecutive month, dry natural gas production increased year to year for the month. The preliminary level for dry natural gas production in November 2018 was 2,646 billion cubic feet (Bcf), or 88.2 Bcf/d. This level was 9.2 Bcf/d (11.6%) higher than the November 2017 level of 79.0 Bcf/d. The average daily rate of dry natural gas production for November was the highest for any month since EIA began tracking monthly dry natural gas production in 1973. |

2019, January, 23, 11:20:00
U.S. PRODUCTION: OIL + 62 TBD, GAS + 849 MCFDU.S. EIA - Crude oil production from the major US onshore regions is forecast to increase 62,000 b/d month-over-month in February from 8,117 to 8,179 thousand barrels/day , gas production to increase 849 million cubic feet/day from 76,708 to 77,557 million cubic feet/day . |

2019, January, 9, 11:05:00
U.S. GAS UPEIA - In 2018, the average annual Henry Hub natural gas spot price increased to $3.16 per million British thermal units (MMBtu), up 15 cents from the 2017 average. |

2018, December, 24, 12:00:00
U.S. PRIMARY ENERGY PRODUCTION 8.0 QUADRILLION BTUU.S. EIA - U.S. primary energy production totaled 8.0 quadrillion British thermal units (Btu), a 10% increase compared with September 2017. |

2018, December, 21, 14:20:00
U.S. PRODUCTION: OIL + 134 TBD, GAS + 1,127 MCFDU.S. EIA - Crude oil production from the major US onshore regions is forecast to increase 134,000 b/d month-over-month in January from 8,032 to 8,166 thousand barrels/day , gas production to increase 1,127 million cubic feet/day from 75,789 to 76,916 million cubic feet/day . |

2018, December, 17, 10:00:00
U.S. RIGS DOWN 4 TO 1,071BHGE - U.S. Rig Count is down 4 rigs from last week to 1,071, with oil rigs down 4 to 873 and gas rigs unchanged at 198. Canada Rig Count is down 12 rigs from last week to 174, with oil rigs down 7 to 95 and gas rigs down 5 to 79. |


