2019-02-01 11:25:00
U.S. OIL PRODUCTION 11.9 MBD
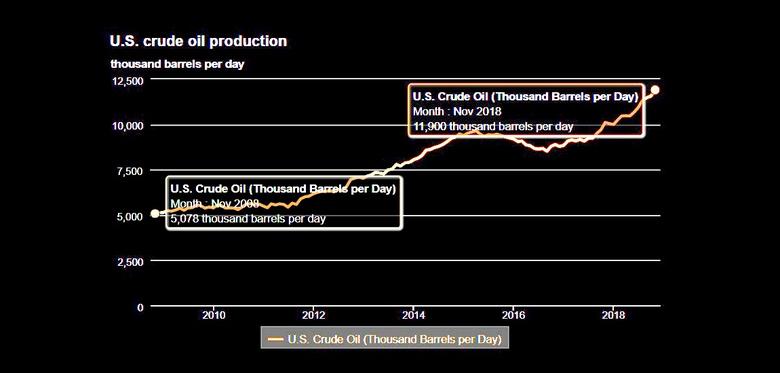
U.S. EIA - U.S. crude oil production rose to a new high of 11.9 million barrels per day in November, up 345,000 bpd from the previous month.
The increase came as output in Texas rose 115,000 bpd and Gulf of Mexico offshore production rose by 188,000 bpd, outstripping a slight decline in North Dakota, where production fell by 11,000 bpd.
U.S. crude production was up 17.8 percent from a year earlier.
U.S. total oil demand in November was up 3 percent, or 615,000 bpd, versus last year, buoyed by strong demand for gasoline and diesel.
U.S. gasoline demand was up 1.1 percent, or 100,000 bpd, versus last year.
Gasoline demand was down 0.8 percent in October. Gasoline demand is closely watched by traders because the U.S. accounts for roughly 10 percent of global gasoline demand.
U.S. distillate demand was up 2.3 percent, or 96,000 bpd, in November.
In October, distillate demand rose by 10.4 percent year-over-year.
Meanwhile, gross natural gas production in the lower 48 U.S. states rose to an all-time high of 97.7 billion cubic feet per day (bcfd) in November, up from the prior record of 96.8 bcfd in October.
In Texas, the nation's largest gas producer, output increased to a record high of 25.3 bcfd in November, up 0.2 percent from October. That compares with output of 22.7 bcfd in November 2017.
In Pennsylvania, the second biggest gas producing state, production rose to a record 18.2 bcfd in November, up 1.7 percent from October. That compares with output of 15.8 bcfd in November 2017.


-----
Earlier:

2019, January, 28, 10:15:00
U.S. OIL PRODUCTION 11.7 MBDAPI - U.S. production of crude oil (11.7 mb/d) and natural gas liquids (NGLs) (4.8 mb/d); Crude oil exports (2.4 mb/d, tie with Nov. 2018);
|

2019, January, 28, 10:05:00
U.S. ENERGY OUTLOOK 2019EIA - U.S. crude oil production continues to set annual records through the mid-2020s and remains greater than 14.0 million barrels per day (b/d) through 2040. The continued development of tight oil and shale gas resources, particularly those in the East and Southwest regions, supports growth in NGPL production—which reaches 6.0 million b/d by 2030—and dry natural gas production. Dry natural gas production reaches 43.4 trillion cubic feet by 2050. |

2019, January, 23, 11:20:00
U.S. PRODUCTION: OIL + 62 TBD, GAS + 849 MCFDU.S. EIA - Crude oil production from the major US onshore regions is forecast to increase 62,000 b/d month-over-month in February from 8,117 to 8,179 thousand barrels/day , gas production to increase 849 million cubic feet/day from 76,708 to 77,557 million cubic feet/day .
|

2019, January, 9, 11:05:00
U.S. GAS UPEIA - In 2018, the average annual Henry Hub natural gas spot price increased to $3.16 per million British thermal units (MMBtu), up 15 cents from the 2017 average.
|

2019, January, 7, 09:55:00
U.S. OIL INVENTORIES 441.4 MBBLOGJ - US commercial crude oil inventories, excluding the Strategic Petroleum Reserve, remained virtually unchanged for the week ended Dec. 28, 2018,
|

2018, December, 26, 07:20:00
U.S. OIL INVENTORIES 441.5 MBBL DOWN 500 TBBLOGJ - US crude oil inventories, excluding the Strategic Petroleum Reserve, decreased by 500,000 bbl for the week ended Dec. 14, according to data from the US Energy Information Administration.
|

2018, December, 24, 11:55:00
U.S. OIL CAPEX DOWNPLATTS - Three aggressive independent Permian Basin upstream operators released capital budgets for 2019 in the last few days that are lower than either prior expectations or actual 2018 spending by at least 12% to 15%, as corporate executives attributed reduced activity to the recent plunge in oil prices. |


