2019-02-25 11:25:00
U.S. RIGS DOWN 4 TO 1,047

BHGE - U.S. Rig Count is down 4 rigs from last week to 1,047 rigs, with oil rigs down 4 to 853 and gas rigs unchanged at 194.
U.S. Rig Count is up 69 rigs from last year's count of 978, with oil rigs up 54 and gas rigs up 15.
The U.S. Offshore Rig Count is down 2 rigs to 19 and up 2 rigs year-over-year.
Canada Rig Count is down 12 rigs from last week to 212, with oil rigs down 8 to 144 and gas rigs down 4 to 68.
Canada Rig Count is down 94 rigs from last year's count of 306, with oil rigs down 65 and gas rigs down 29.
| Rotary Rig Count | |||||||||
| 2/22/19 | |||||||||
| Week | Year | ||||||||
| Location | Week | +/- | Ago | +/- | Ago | ||||
| Land | 1026 | -2 | 1028 | 67 | 959 | ||||
| Inland Waters | 2 | 0 | 2 | 0 | 2 | ||||
| Offshore | 19 | -2 | 21 | 2 | 17 | ||||
| United States Total | 1047 | -4 | 1051 | 69 | 978 | ||||
| Gulf Of Mexico | 19 | -2 | 21 | 2 | 17 | ||||
| Canada | 212 | -12 | 224 | -94 | 306 | ||||
| North America | 1259 | -16 | 1275 | -25 | 1284 | ||||
| U.S. Breakout Information | This Week | +/- | Last Week | +/- | Year Ago | ||||
| Oil | 853 | -4 | 857 | 54 | 799 | ||||
| Gas | 194 | 0 | 194 | 15 | 179 | ||||
| Directional | 68 | -2 | 70 | -1 | 69 | ||||
| Horizontal | 916 | 1 | 915 | 74 | 842 | ||||
| Vertical | 63 | -3 | 66 | -4 | 67 | ||||
| Canada Breakout Information | This Week | +/- | Last Week | +/- | Year Ago | ||||
| Oil | 144 | -8 | 152 | -65 | 209 | ||||
| Gas | 68 | -4 | 72 | -29 | 97 | ||||
| Major State Variances | This Week | +/- | Last Week | +/- | Year Ago | ||||
| Alaska | 13 | 1 | 12 | 4 | 9 | ||||
| California | 12 | 1 | 11 | -2 | 14 | ||||
| Colorado | 34 | -1 | 35 | 1 | 33 | ||||
| Louisiana | 64 | -2 | 66 | 4 | 60 | ||||
| New Mexico | 108 | -1 | 109 | 21 | 87 | ||||
| North Dakota | 57 | 0 | 57 | 8 | 49 | ||||
| Ohio | 18 | 0 | 18 | -4 | 22 | ||||
| Oklahoma | 117 | -2 | 119 | -4 | 121 | ||||
| Pennsylvania | 44 | 0 | 44 | 5 | 39 | ||||
| Texas | 508 | -1 | 509 | 26 | 482 | ||||
| Utah | 8 | 0 | 8 | -2 | 10 | ||||
| West Virginia | 19 | 1 | 18 | 3 | 16 | ||||
| Wyoming | 37 | 0 | 37 | 6 | 31 | ||||
| Major Basin Variances | This Week | +/- | Last Week | +/- | Year Ago | ||||
| Ardmore Woodford | 5 | 0 | 5 | 4 | 1 | ||||
| Arkoma Woodford | 5 | 0 | 5 | -2 | 7 | ||||
| Barnett | 1 | -1 | 2 | -1 | 2 | ||||
| Cana Woodford | 56 | -3 | 59 | -13 | 69 | ||||
| DJ-Niobrara | 32 | 1 | 31 | 6 | 26 | ||||
| Eagle Ford | 82 | 0 | 82 | 12 | 70 | ||||
| Granite Wash | 5 | 1 | 4 | -7 | 12 | ||||
| Haynesville | 57 | 1 | 56 | 6 | 51 | ||||
| Marcellus | 62 | 1 | 61 | 8 | 54 | ||||
| Mississippian | 10 | 0 | 10 | 6 | 4 | ||||
| Permian | 473 | 0 | 473 | 38 | 435 | ||||
| Utica | 19 | 0 | 19 | -4 | 23 | ||||
| Williston | 57 | 0 | 57 | 7 | 50 | ||||
-----
Earlier:
2019, February, 20, 11:35:00
U.S. PRODUCTION: OIL + 84 TBD, GAS + 858 MCFD
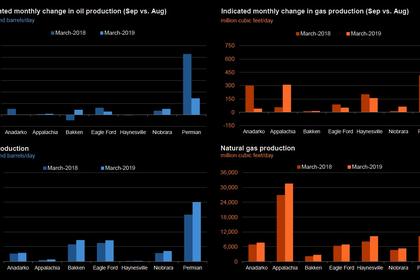
U.S. EIA - Crude oil production from the major US onshore regions is forecast to increase 84,000 b/d month-over-month in March from 8,314 to 8,398 thousand barrels/day , gas production to increase 858 million cubic feet/day from 77,109 to 77,967 million cubic feet/day .
2019, February, 18, 12:25:00
OIL DEMAND GROWTH 1.4 MBD
IEA - Growth in 4Q18 was robust at 1.4 mb/d y-o-y and for 2018 as a whole growth was 1.3 mb/d.
2019, February, 18, 12:15:00
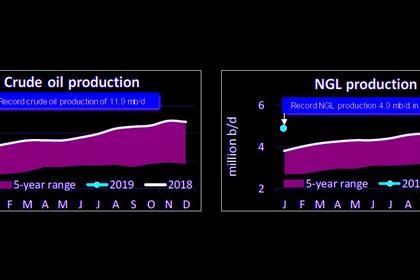
U.S. OIL PRODUCTION 11.9 MBD AGAIN
API - Strongest gasoline demand (8.9 million barrels per day, mb/d) for the month January on record since 1945.
Record refinery and petrochemical demand for other oils’ in any month (5.7 mb/d)
U.S. production of crude oil (11.9 mb/d) and natural gas liquids (NGLs) (4.9 mb/d)
Refinery throughput (17.3 mb/d) and capacity utilization (93.1 percent) for the month of January.
2019, February, 18, 11:55:00
U.S. TIGHT OIL PRODUCTION 7 MBD
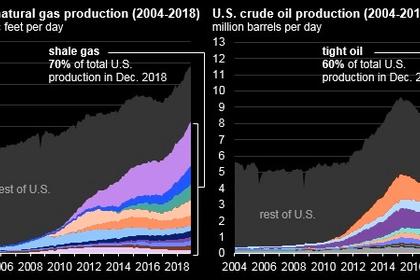
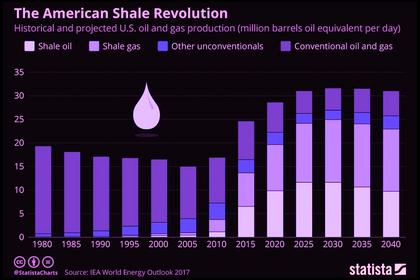
U.S. EIA - In December 2018, U.S. shale and tight plays produced about 65 billion cubic feet per day (Bcf/d) of natural gas (70% of total U.S. dry gas production) and about 7 million barrels per day (b/d) of crude oil (60% of total U.S. oil production). A decade ago, in December 2008, shale gas and tight oil accounted for 16% of total U.S. gas production and about 12% of U.S. total crude oil production.
2019, February, 18, 11:50:00
U.S. SHALE NEED INVESTMENT
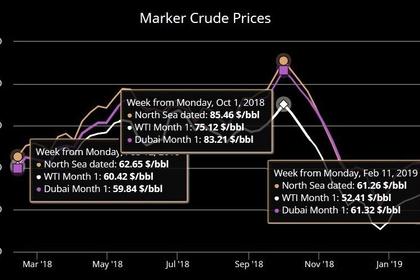
REUTERS - On Thursday, the regional price of crude was at a $1.10 a barrel premium to U.S. crude futures, the strongest in more than a year as companies including Parsley Energy, Pioneer Natural Resources, Goodrich Petroleum Corp have pared their exploration budgets, easing the constraints.

2019, February, 18, 11:30:00
U.S. RIGS UP 2 TO 1,051
BHGE - U.S. Rig Count is up 2 rigs from last week to 1,051 rigs, Canada Rig Count is down 16 rigs from last week to 224,
2019, February, 11, 10:00:00
U.S. RIGS UP 4 TO 1,049
BHGE - U.S. Rig Count is up 4 rigs from last week to 1,049 rigs, with oil rigs up 7 to 854 and gas rigs down 3 to 195. Canada Rig Count is down 3 rigs from last week to 240, with oil rigs down 1 to 158 and gas rigs down 2 to 82.


