2019-02-18 11:55:00
U.S. TIGHT OIL PRODUCTION 7 MBD
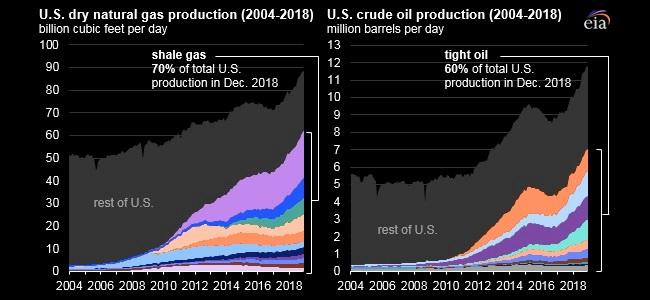
U.S. EIA - In December 2018, U.S. shale and tight plays produced about 65 billion cubic feet per day (Bcf/d) of natural gas (70% of total U.S. dry gas production) and about 7 million barrels per day (b/d) of crude oil (60% of total U.S. oil production).
A decade ago, in December 2008, shale gas and tight oil accounted for 16% of total U.S. gas production and about 12% of U.S. total crude oil production.

EIA recently updated its methodology and production volume estimates for U.S. shale gas and tight oil plays to include seven additional plays, increasing the share of shale gas by about 9% and tight oil by 8% compared with previously estimated shale production volumes. The update captures increasing production from new, emerging plays as well as from older plays that had been in decline but are rebounding because of advancements in horizontal drilling and hydraulic fracturing. The selected plays are identified by examining the reservoir names reported by operators to state agencies. EIA uses the third party data source, Drillinginfo, which collects and distributes well level data gathered by the states.

The most productive of the newly added plays is the Mississippian formation, which is located mainly in Oklahoma within the Anadarko Basin. The mainly carbonate rock type lies above the Woodford play and has produced liquids and natural gas for some time, but newer completion techniques have driven recent production gains.
The remaining six plays are smaller and are included in the rest of U.S. tight oil and shale gas categories.
- The Burket and Geneseo formations in the Appalachian Basin of Pennsylvania and West Virginia increased production in recent years. These dry shale gas formations lie above the Marcellus Shale but are thinner and do not cover as large an area as the Marcellus.
- The Uteland Butte member of the Green River Formation in the Uinta Basin of Utah is composed primarily of limestone, dolostone, and organic rich mudstones and siltstones.
- The Turner, Frontier, Sussex-Shannon, and Teapot-Parkman formations are located in the Powder River Basin of Wyoming and lie below and above the Niobrara formation, the basin’s primary hydrocarbon-bearing formation. They are mainly fine-grained sandstone with interbedded silt and shale

Because the collection and reporting of oil and natural gas production by state agencies can lag between 2 and 18 months, EIA's methodology compensates by estimating the incomplete production data up to the latest report month (presently December 2018). For this reason, EIA volumes may differ from state agency data where reports from operators may be incomplete. Once final production data from state agencies become available, EIA data are revised to reflect the actual production data.
Region totals from EIA's Drilling Productivity Report are the main input variable to guide the projections, supplemented with pipeline rates from PointLogic Energy, well completion data from FracFocus, and EIA's survey data of monthly production by state. The methodology also includes an update of the wet-to-dry ratio used to calculate the dry gas volumes from the natural gas gross withdrawals received from the states through Drillinginfo. This ratio is derived from EIA's Natural Gas Annual and from EIA's Reserves Report.
-----
Earlier:

2019, February, 11, 10:00:00
U.S. RIGS UP 4 TO 1,049BHGE - U.S. Rig Count is up 4 rigs from last week to 1,049 rigs, with oil rigs up 7 to 854 and gas rigs down 3 to 195. Canada Rig Count is down 3 rigs from last week to 240, with oil rigs down 1 to 158 and gas rigs down 2 to 82. |

2019, February, 8, 11:45:00
U.S. GAS RECORDEIA - Total estimated consumption by the power, industrial, and residential/commercial sectors and total estimated natural gas exports—by pipeline and as feedstock to liquefied natural gas (LNG) facilities—reached 145.9 billion cubic feet (Bcf) on January 30, compared with the previous record of 143.9 Bcf set in 2018. |

2019, February, 1, 11:25:00
U.S. OIL PRODUCTION 11.9 MBDU.S. EIA - U.S. crude oil production rose to a new high of 11.9 million barrels per day in November, up 345,000 bpd from the previous month, |

2019, February, 1, 11:10:00
U.S. GAS PRODUCTION UP 11.6%EIA - In November 2018, for the 19th consecutive month, dry natural gas production increased year to year for the month. The preliminary level for dry natural gas production in November 2018 was 2,646 billion cubic feet (Bcf), or 88.2 Bcf/d. This level was 9.2 Bcf/d (11.6%) higher than the November 2017 level of 79.0 Bcf/d. The average daily rate of dry natural gas production for November was the highest for any month since EIA began tracking monthly dry natural gas production in 1973. |

2019, January, 28, 10:15:00
U.S. OIL PRODUCTION 11.7 MBDAPI - U.S. production of crude oil (11.7 mb/d) and natural gas liquids (NGLs) (4.8 mb/d); Crude oil exports (2.4 mb/d, tie with Nov. 2018); |

2019, January, 28, 10:05:00
U.S. ENERGY OUTLOOK 2019EIA - U.S. crude oil production continues to set annual records through the mid-2020s and remains greater than 14.0 million barrels per day (b/d) through 2040. The continued development of tight oil and shale gas resources, particularly those in the East and Southwest regions, supports growth in NGPL production—which reaches 6.0 million b/d by 2030—and dry natural gas production. Dry natural gas production reaches 43.4 trillion cubic feet by 2050. |

2019, January, 23, 11:20:00
U.S. PRODUCTION: OIL + 62 TBD, GAS + 849 MCFDU.S. EIA - Crude oil production from the major US onshore regions is forecast to increase 62,000 b/d month-over-month in February from 8,117 to 8,179 thousand barrels/day , gas production to increase 849 million cubic feet/day from 76,708 to 77,557 million cubic feet/day . |


