2019-02-04 09:30:00


U.S. UNEMPLOYMENT UP TO 4%
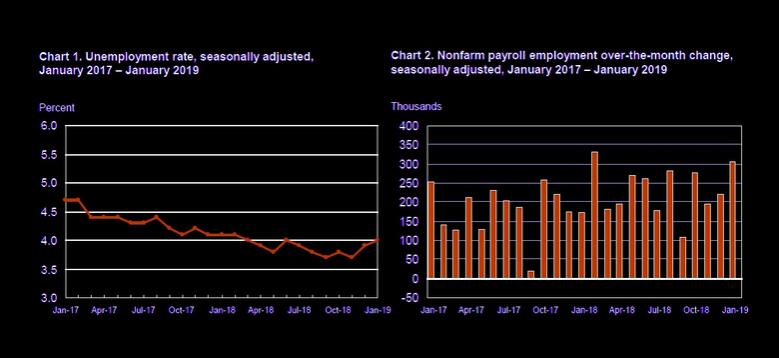
U.S. BLS - Total nonfarm payroll employment increased by 304,000 in January, and the unemployment rate edged up to 4.0 percent, the U.S. Bureau of Labor Statistics reported. Job gains occurred in several industries, including leisure and hospitality, construction, health care, and transportation and warehousing.
Household Survey Data
Both the unemployment rate, at 4.0 percent, and the number of unemployed persons, at 6.5 million, edged up in January. The impact of the partial federal government shutdown contributed to the uptick in these measures. Among the unemployed, the number who reported being on temporary layoff increased by 175,000. This figure includes furloughed federal employees who were classified as unemployed on temporary layoff under the definitions used in the household survey. (See tables A-1 and A-11. For information about annual population adjustments to the household survey estimates, see the note at the end of this release and tables B and C. For more information on the classification of workers affected by the partial federal government shutdown, see the box note at the end of this news release.)
Among the major worker groups, the unemployment rate for Hispanics increased to 4.9 percent in January. The jobless rates for adult men (3.7 percent), adult women (3.6 percent), teenagers (12.9 percent), Whites (3.5 percent), Blacks (6.8 percent), and Asians (3.1 percent) showed little change over the month. (See tables A-1, A-2, and A-3.)
In January, the number of long-term unemployed (those jobless for 27 weeks or more) was little changed at 1.3 million and accounted for 19.3 percent of the unemployed. (See table A-12.)
The labor force participation rate, at 63.2 percent, and the employment-population ratio, at 60.7 percent, changed little over the month; both measures were up by 0.5 percentage point over the year. (See table A-1.)
The number of persons employed part time for economic reasons (sometimes referred to as involuntary part-time workers) increased by about one-half million to 5.1 million in January. Nearly all of this increase occurred in the private sector and may reflect the impact of the partial federal government shutdown. (Persons employed part time for economic reasons would have preferred full-time employment but were working part time because their hours had been reduced or they were unable to find full-time jobs.) (See table A-8.)
In January, 1.6 million persons were marginally attached to the labor force, essentially unchanged from a year earlier. (Data are not seasonally adjusted.) These individuals were not in the labor force, wanted and were available for work, and had looked for a job sometime in the prior 12 months. They were not counted as unemployed because they had not searched for work in the 4 weeks preceding the survey. (See table A-16.)
Among the marginally attached, there were 426,000 discouraged workers in January, little different than a year earlier. (Data are not seasonally adjusted.)
Discouraged workers are persons not currently looking for work because they believe no jobs are available for them. The remaining 1.2 million persons marginally attached to the labor force in January had not searched for work for reasons such as school attendance or family responsibilities. (See table A-16.)
Establishment Survey Data
Total nonfarm payroll employment increased by 304,000 in January, compared with an average monthly gain of 223,000 in 2018. In January, employment grew in several industries, including leisure and hospitality, construction, health care, and transportation and warehousing. There were no discernible impacts of the partial federal government shutdown on the estimates of employment, hours, and earnings from the establishment survey. (See table B-1. For information about the annual benchmark process, see the note at the end of this release and table A. For more information on the classification of workers affected by the partial federal government shutdown, see the box note at the end of this news release.)
In January, employment in leisure and hospitality rose by 74,000. Within the industry, job gains occurred in food services and drinking places (+37,000) and in amusements, gambling, and recreation (+32,000). Over the year, leisure and hospitality has added 410,000 jobs.
Construction employment rose by 52,000 in January. Job gains occurred among specialty trade contractors, with increases in both the nonresidential (+19,000) and residential (+15,000) components. Employment also rose in heavy and civil engineering construction (+10,000) and residential building (+9,000). Construction has added 338,000 jobs over the past 12 months.
Employment in health care increased by 42,000 in January. Within the industry, job gains occurred in ambulatory health care services (+22,000) and hospitals (+19,000).
Health care has added 368,000 jobs over the past year.
Over the month, employment in transportation and warehousing rose by 27,000, following little change in December. In January, job gains occurred in warehousing and storage (+15,000) and among couriers and messengers (+7,000). Over the year, employment in transportation and warehousing has increased by 219,000.
In January, retail trade employment edged up by 21,000. Job gains occurred in sporting goods, hobby, book, and music stores (+17,000), while general merchandise stores lost jobs (-12,000). Employment in retail trade has shown little net change over the past 12 months (+26,000).
Mining employment increased by 7,000 in January. The industry has added 64,000 jobs over the year, almost entirely in support activities for mining.
Employment in professional and business services continued to trend up over the month (+30,000) and has increased by 546,000 in the past 12 months.
Employment in manufacturing continued to trend up in January (+13,000). Over-the- month job gains occurred in durable goods (+20,000), while employment in nondurable goods changed little (-7,000). Manufacturing employment has increased by 261,000 over the year, with more than four-fifths of the gain in durable goods industries.
Employment in federal government was essentially unchanged in January (+1,000). Federal employees on furlough during the partial government shutdown were counted as employed in the establishment survey because they worked or received pay (or will receive pay) for the pay period that included the 12th of the month.
Employment showed little change over the month in other major industries, including wholesale trade, information, and financial activities.
The average workweek for all employees on private nonfarm payrolls was unchanged at 34.5 hours in January. In manufacturing, both the workweek and overtime decreased by 0.1 hour to 40.8 hours and 3.5 hours, respectively. The average workweek for production and nonsupervisory employees on private nonfarm payrolls held at 33.7 hours. (See tables B-2 and B-7.)
In January, average hourly earnings for all employees on private nonfarm payrolls rose by 3 cents to $27.56, following a 10-cent gain in December. Over the year, average hourly earnings have increased by 85 cents, or 3.2 percent. Average hourly earnings of private-sector production and nonsupervisory employees increased by 3 cents to $23.12 in January. (See tables B-3 and B-8.)
The change in total nonfarm payroll employment for November was revised up from +176,000 to +196,000, and the change for December was revised down from +312,000 to +222,000. With these revisions, employment gains in November and December combined were 70,000 less than previously reported. After revisions, job gains have averaged 241,000 per month over the last 3 months. (Monthly revisions result from additional reports received from businesses and government agencies since the last published estimates and from the recalculation of seasonal factors. The annual benchmark process also contributed to the November and December revisions.)
-----
Earlier:

2019, January, 7, 09:10:00
U.S. UNEMPLOYMENT UP TO 3.9%U.S. BLS - Total nonfarm payroll employment increased by 312,000 in December, and the unemployment rate rose to 3.9 percent, the U.S. Bureau of Labor Statistics reported today. Job gains occurred in health care, food services and drinking places, construction, manufacturing, and retail trade.
|

2018, December, 10, 08:30:00
U.S. UNEMPLOYMENT: 3.7%U.S. BLS - Total nonfarm payroll employment increased by 155,000 in November, and the unemployment rate remained unchanged at 3.7 percent, the U.S. Bureau of Labor Statistics reported today. Job gains occurred in health care, in manufacturing, and in transportation and warehousing.
|

2018, November, 5, 12:01:00
U.S. UNEMPLOYMENT 3.7%U.S. BLS - Total nonfarm payroll employment rose by 250,000 in October, and the unemployment rate was unchanged at 3.7 percent, the U.S. Bureau of Labor Statistics reported today. Job gains occurred in health care, in manufacturing, in construction, and in transportation and warehousing.
|

2018, October, 8, 10:15:00
U.S. UNEMPLOYMENT DOWN TO 3.7%U.S. BLS - The unemployment rate declined to 3.7 percent in September, and total nonfarm payroll employment increased by 134,000, the U.S. Bureau of Labor Statistics reported today. Job gains occurred in professional and business services, in health care, and in transportation and warehousing.
|

2018, September, 10, 12:10:00
U.S. UNEMPLOYMENT 3.9%U.S. DL - The unemployment rate remained at 3.9 percent in August, and the number of unemployed persons, at 6.2 million, changed little.
|

2018, August, 6, 13:10:00
U.S. UNEMPLOYMENT DOWN TO 3.9%U.S. BLS - Total nonfarm payroll employment rose by 157,000 in July, and the unemployment rate edged down to 3.9 percent, the U.S. Bureau of Labor Statistics reported today. Employment increased in professional and business services, in manufacturing, and in health care and social assistance.
|

2018, July, 9, 14:55:00
U.S. UNEMPLOYMENT UP TO 4%U.S. BLS - Total nonfarm payroll employment increased by 213,000 in June, and the unemployment rate rose to 4.0 percent, |

