2019-03-07 11:50:00


2018: U.S. TRADE DEFICIT UP 12.5%
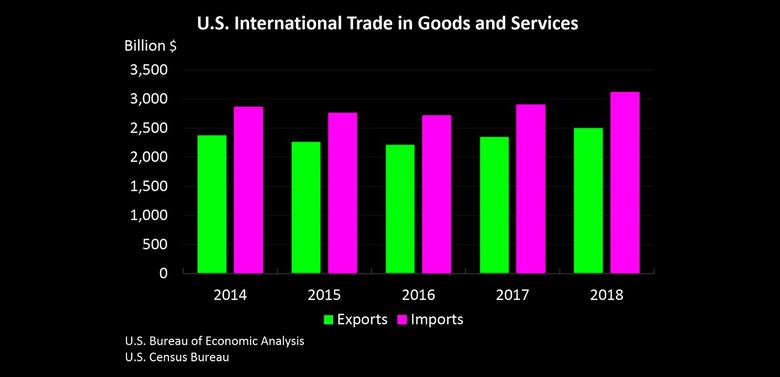

U.S. BEA - For 2018, the goods and services deficit was $621.0 billion, up $68.8 billion from $552.3 billion in 2017. Exports were $2,500.0 billion in 2018, up $148.9 billion from 2017. Imports were $3,121.0 billion, up $217.7 billion from 2017.
The 2018 increase in the goods and services deficit reflected an increase in the goods deficit of $83.8 billion, or 10.4 percent, to $891.3 billion and an increase in the services surplus of $15.0 billion, or 5.9 percent, to $270.2 billion.
As a percentage of U.S. gross domestic product, the goods and services deficit was 3.0 percent in 2018, up from 2.8 percent in 2017.
Exports
Exports of goods increased $118.5 billion to $1,671.8 billion in 2018.
Exports of goods on a Census basis increased $117.8 billion.
- Industrial supplies and materials increased $74.2 billion.
- Crude oil increased $24.6 billion.
- Other petroleum products increased $14.4 billion.
- Capital goods increased $28.7 billion.
- Civilian aircraft engines increased $7.9 billion.
- Other industrial machines increased $2.9 billion.
- Computer accessories increased $2.5 billion.
Net balance of payments adjustments increased $0.6 billion.
Exports of services increased $30.4 billion to $828.1 billion in 2018.
- Other business services, which includes research and development services; professional and management services; and technical, trade-related, and other services, increased $8.5 billion.
- Financial services increased $4.6 billion.
- Travel (for all purposes including education) increased $4.3 billion.
Imports
Imports of goods increased $202.2 billion to $2,563.1 billion in 2018.
Imports of goods on a Census basis increased $200.8 billion.
- Industrial supplies and materials increased $68.4 billion.
- Crude oil increased $24.6 billion.
- Capital goods increased $52.7 billion.
- Computers increased $8.7 billion.
- Electric apparatus increased $5.4 billion.
- Computer accessories increased $5.4 billion.
- Other industrial machines increased $5.1 billion.
- Consumer goods increased $46.1 billion.
- Pharmaceutical preparations increased $23.7 billion.
Net balance of payments adjustments increased $1.4 billion.
Imports of services increased $15.4 billion to $557.9 billion in 2018.
- Travel (for all purposes including education) increased $10.1 billion.
- Other business services increased $7.0 billion.
- Transport increased $6.5 billion.
- Insurance services decreased $13.0 billion.
-----
Earlier:

2019, March, 1, 11:50:00
U.S. GDP UP 2.6%U.S. BEA - Real gross domestic product (GDP) increased at an annual rate of 2.6 percent in the fourth quarter of 2018, according to the "initial" estimate released by the Bureau of Economic Analysis. In the third quarter, real GDP increased 3.4 percent. |

2019, February, 25, 11:55:00
U.S. SHALE OIL WEAKNESSREUTERS - Weak returns at U.S. shale producers could cost more executives their jobs and lead to increasing battles with activist investors, analysts said following changes at two producers. |

2019, February, 18, 11:45:00
U.S. INDUSTRIAL PRODUCTION DOWN 0.6%U.S. FRB - Industrial production decreased 0.6 percent in January after rising 0.1 percent in December. |

2019, February, 8, 11:20:00
U.S. DEFICIT $49.3 BLNU.S. BEA - The U.S. Census Bureau and the U.S. Bureau of Economic Analysis announced that the goods and services deficit was $49.3 billion in November, down $6.4 billion from $55.7 billion in October, revised. |

2019, February, 6, 10:25:00
IMF: GLOBAL DEBTIMF - Global debt has reached an all-time high of $184 trillion in nominal terms, the equivalent of 225 percent of GDP in 2017. On average, the world’s debt now exceeds $86,000 in per capita terms, which is more than 2½ times the average income per-capita. |

2019, February, 1, 10:55:00
U.S. FEDERAL FUNDS RATE 2.25-2.5%U.S. FRB - Consistent with its statutory mandate, the Committee seeks to foster maximum employment and price stability. In support of these goals, the Committee decided to maintain the target range for the federal funds rate at 2-1/4 to 2-1/2 percent. |

2019, January, 30, 11:05:00
U.S. GDP UP 3.2%U.S. DT - Over the first three quarters of 2018, the U.S. economy grew at an annualized rate of 3.2 percent, the fastest pace for the first three quarters of a year since 2005. Initial data for the fourth quarter indicate the economy continued to perform well, although slowing global growth and the housing sector could present headwinds. Private forecasters in the Blue Chip Economic Indicators monthly survey now estimate that real GDP growth slowed to 2.7 percent in the fourth quarter, and will slow further to 2.2 percent in the first quarter of 2019. |


