2019-03-13 10:45:00


MALAYSIA'S GDP UP 4.7%
IMF - On February 15, 2019, the Executive Board of the International Monetary Fund (IMF) concluded the 2019 Article IV consultation with Malaysia.
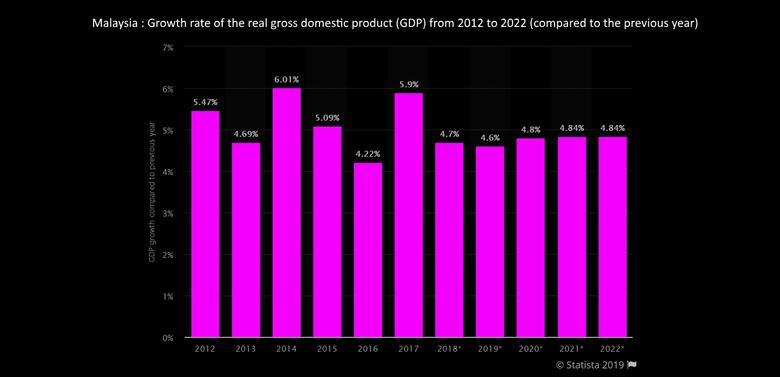
Malaysia’s economy continues to perform well despite external headwinds. Growth has averaged above 5 percent over the past 5 years, leading to higher per capita income and reducing already-low poverty. Economic growth is now moderating, and is estimated at 4.7 percent in 2018, underpinned by robust domestic and external demand. Headline inflation dropped from an average of 3.7 percent in 2017 to an estimated 1 percent in 2018 as domestic fuel price adjustment was suspended, the GST was zero-rated and replaced by the narrower-base SST, and food price inflation declined. The credit-to-GDP ratio is declining. On the external side, the current account surplus is estimated at 2.2 percent of GDP in 2018, having gradually narrowed in recent years as growth drivers have shifted towards domestic demand.
Growth is expected to stabilize in 2019 and over the medium term, with inflation picking up and the current account surplus continuing to narrow. Domestic demand will remain the main driver of growth, with private consumption and investment supported by an improved business environment and investor confidence. This would counterbalance the negative drag from the external environment and fiscal consolidation, leaving growth flat at 4.7 percent in 2019 and close to potential (about 4¾ percent) over the medium term. Inflation would rise above 2 percent in 2019, as the effect of the GST removal dissipates and oil subsidies become targeted. Over the medium term, growth is expected to converge to potential and inflation will remain subdued.
Risks to the growth outlook are to the downside and stem largely from external factors. Malaysia’s highly open economy is vulnerable to rising protectionism, weaker-than-expected growth in trading partners, or a significant slowdown in China. A sharp tightening of global financial conditions could cause financial stress, while lower-than-projected oil prices could reduce exports and growth. Domestically, contingent liabilities could necessitate additional measures to ensure medium-term fiscal sustainability, while delays or resistance to the governance reform agenda could undermine confidence, leading to lower investment and growth.
Executive Board Assessment
Executive Directors commended the authorities for the resilient performance of the Malaysian economy over recent years, noting that growth was solid, without signs of inflationary pressures. Directors concurred that, while the medium‑term outlook remains favorable, risks are tilted to the downside stemming primarily from the external environment. They encouraged the authorities to continue implementing credible macroeconomic policies while safeguarding growth and financial stability, and undertaking structural reforms to boost sustainable, inclusive growth.
Directors agreed with the planned gradual pace of fiscal consolidation in 2019 and over the medium term to support debt reduction and strengthened fiscal buffers. They encouraged the authorities to embed the medium‑term fiscal path in a strengthened fiscal framework that would rely on credible revenue and expenditure measures. Noting Malaysia’s low tax revenue ratio, Directors emphasized that revenue mobilization should be a priority, not only to support medium‑term consolidation, but also to help finance needed expenditure to achieve government priorities identified under the Mid‑Term Review of the Eleventh Malaysia Plan. They welcomed continued efforts to increase fiscal transparency.
Directors supported the broadly neutral monetary policy stance. Going forward, domestic economic and financial conditions should continue to guide monetary policy decisions, with exchange rate flexibility the first line of defense against shocks. Directors noted that exchange rate flexibility should help further financial market deepening. A number of Directors encouraged the authorities to phase out the 2016 FX market measures with due regard to market conditions. Some Directors were of the view that such measures could be helpful in preserving overall financial stability.
Directors agreed that the financial sector appears resilient, with sound profitability and liquidity indicators and low NPLs. They encouraged the authorities to continue close monitoring of risks stemming from large household debt and the real estate market, noting that household debt is high compared to peers, with a large share of mortgages and with pockets of vulnerability among lower‑income groups. A number of Directors agreed that the measures related to the residency‑based differentiation in the property market should be gradually phased out as systemic risks dissipate. A few Directors suggested a more cautious approach should be taken in phasing out these measures. Directors commended the authorities’ ongoing efforts to enhance crisis preparedness noting that they could be strengthened by a comprehensive review of the overall framework.
Directors commended the authorities’ initiatives to improve governance and strengthen anti‑corruption institutions and emphasized the importance of anchoring them in appropriate legislation, particularly to help secure their independence. Directors encouraged continued strengthening of the AML/CFT framework.
Directors agreed with the authorities’ emphasis on raising productivity and achieving inclusive and regionally balanced development. They encouraged prioritizing human capital development and increasing female labor force participation and productivity, including through improving education; accelerating innovation and technology adoption; and encouraging a move up the value chain.
|
Malaysia: Selected Economic and Financial Indicators, 2014–20
|
|||||||
|
Nominal GDP (2018, est.): US$353.6 billion |
Population (2018, mid-year): 32.4 million |
||||||
|
GDP per capita (2018, current prices, est.): US$10,919 |
Poverty rate (2016, national poverty line): 0.4 percent |
||||||
|
Unemployment rate (August 2018): 3.4 percent |
Adult literacy rate (2017): 95.9 percent |
||||||
|
Main goods exports (share in total, 2017): electrical & electronics (36.7 percent), commodities (13.6 percent), and petroleum products (7.7 percent). |
|||||||
|
Est. |
Proj. |
||||||
|
2014 |
2015 |
2016 |
2017 |
2018 |
2019 |
2020 |
|
|
Real GDP (percent change) |
6.0 |
5.1 |
4.2 |
5.9 |
4.7 |
4.7 |
4.8 |
|
Total domestic demand |
5.3 |
6.0 |
4.5 |
6.6 |
4.6 |
5.1 |
4.8 |
|
Private consumption |
7.0 |
6.0 |
6.0 |
7.0 |
7.3 |
6.8 |
5.8 |
|
Public consumption |
4.4 |
4.5 |
0.9 |
5.4 |
0.8 |
0.2 |
0.6 |
|
Private investment |
11.1 |
6.3 |
4.3 |
9.3 |
4.4 |
5.5 |
6.0 |
|
Public gross fixed capital formation |
-4.7 |
-1.1 |
-0.5 |
0.1 |
-1.6 |
-2.5 |
1.1 |
|
Net exports (contribution to growth, percentage points) |
1.2 |
-0.3 |
0.1 |
-0.2 |
0.5 |
0.0 |
0.3 |
|
Saving and investment (in percent of GDP) |
|||||||
|
Gross domestic investment |
25.0 |
25.1 |
25.8 |
25.6 |
24.5 |
24.2 |
24.2 |
|
Gross national saving |
29.4 |
28.2 |
28.3 |
28.5 |
26.7 |
26.0 |
25.8 |
|
Fiscal sector (in percent of GDP) 1/ |
|||||||
|
Federal government overall balance |
-3.4 |
-3.2 |
-3.1 |
-3.0 |
-3.7 |
-3.4 |
-3.0 |
|
Revenue |
19.9 |
18.9 |
17.3 |
16.3 |
16.6 |
17.2 |
15.0 |
|
Expenditure and net lending |
23.3 |
22.1 |
20.4 |
19.3 |
20.3 |
18.2 |
18.0 |
|
Tax refunds (Arrears) 2/ |
2.4 |
||||||
|
Federal government non-oil primary balance |
-7.3 |
-5.1 |
-3.5 |
-3.5 |
-5.2 |
-6.6 |
-4.1 |
|
Consolidated public sector overall balance 3/ |
-7.4 |
-7.7 |
-5.1 |
-3.2 |
-5.5 |
-5.8 |
-5.1 |
|
General government debt 3/ |
56.2 |
57.9 |
56.6 |
55.2 |
56.3 |
56.5 |
56.0 |
|
Of which: federal government debt |
52.7 |
54.4 |
52.7 |
50.7 |
51.9 |
52.1 |
51.5 |
|
Inflation and unemployment (annual average, in percent) |
|||||||
|
CPI inflation |
3.2 |
2.1 |
2.1 |
3.7 |
1.0 |
2.2 |
2.6 |
|
CPI inflation (excluding food and energy) 4/ |
2.1 |
3.2 |
2.6 |
1.6 |
0.4 |
1.2 |
2.4 |
|
Unemployment rate |
2.9 |
3.2 |
3.5 |
3.4 |
3.4 |
3.4 |
3.4 |
|
Macrofinancial variables (end of period) |
|||||||
|
Broad money (percentage change) 5/ |
6.3 |
3.0 |
2.7 |
4.8 |
5.5 |
… |
… |
|
Credit to private sector (percentage change) 5/ |
9.2 |
8.6 |
5.3 |
5.4 |
6.0 |
… |
… |
|
Credit-to-GDP ratio (in percent) 4/ 6/ |
130.1 |
134.6 |
133.9 |
128.3 |
129.1 |
… |
… |
|
Credit-to-GDP gap (in percent) 4/ 6/ |
12.7 |
13.5 |
9.4 |
2.5 |
2.6 |
… |
… |
|
Overnight policy rate (in percent) |
3.25 |
3.25 |
3.00 |
3.00 |
3.25 |
… |
… |
|
Three-month interbank rate (in percent) |
3.9 |
3.8 |
3.4 |
3.5 |
3.7 |
… |
… |
|
Nonfinancial corporate sector debt (in percent of GDP) |
98.6 |
106.7 |
109.5 |
102.8 |
104.3 |
… |
… |
|
Nonfinancial corporate sector debt issuance (in percent of GDP) |
3.2 |
2.6 |
3.2 |
3.4 |
3.7 |
… |
… |
|
Household debt (in percent of GDP) |
86.8 |
88.4 |
87.8 |
83.8 |
83.0 |
… |
… |
|
Household financial assets (in percent of GDP) |
182.1 |
183.1 |
181.5 |
177.6 |
… |
… |
… |
|
House prices (percentage change) |
9.4 |
7.4 |
7.1 |
6.5 |
… |
… |
… |
|
Exchange rates (period average) |
|||||||
|
Malaysian ringgit/U.S. dollar |
3.27 |
3.91 |
4.15 |
4.30 |
4.04 |
… |
… |
|
Real effective exchange rate (percentage change) |
-0.7 |
-7.9 |
-4.3 |
-1.7 |
4.1 |
… |
… |
|
Balance of payments (in billions of U.S. dollars) 4/ |
|||||||
|
Current account balance |
14.8 |
9.0 |
7.2 |
9.4 |
7.7 |
6.5 |
6.4 |
|
(In percent of GDP) |
4.4 |
3.0 |
2.4 |
3.0 |
2.2 |
1.8 |
1.6 |
|
Goods balance |
34.6 |
28.0 |
24.6 |
27.2 |
30.7 |
29.8 |
31.3 |
|
Services balance |
-3.3 |
-5.3 |
-4.6 |
-5.3 |
-6.6 |
-6.5 |
-6.9 |
|
Income balance |
-16.5 |
-13.7 |
-12.8 |
-12.5 |
-16.5 |
-16.9 |
-18.0 |
|
Capital and financial account balance |
-24.3 |
-14.5 |
0.0 |
0.9 |
2.3 |
5.5 |
7.0 |
|
Of which: Direct investment |
-5.5 |
-0.5 |
3.3 |
3.8 |
4.1 |
4.3 |
4.6 |
|
Errors and omissions |
-1.7 |
6.4 |
-5.8 |
-6.4 |
-11.0 |
0.0 |
0.0 |
|
Overall balance |
-11.2 |
1.0 |
1.4 |
3.8 |
-1.0 |
12.0 |
13.4 |
|
Gross official reserves (US$ billions) 4/ |
115.9 |
95.3 |
94.5 |
102.4 |
101.4 |
113.4 |
126.8 |
|
(In months of following year's imports of goods and nonfactor services) |
7.5 |
6.3 |
5.6 |
5.8 |
5.5 |
5.9 |
6.2 |
|
(In percent of short-term debt by original maturity) |
111.6 |
116.2 |
112.5 |
109.9 |
105.8 |
112.1 |
121.1 |
|
(In percent of short-term debt by remaining maturity) |
78.3 |
74.4 |
72.6 |
72.5 |
70.4 |
76.1 |
82.3 |
|
Total external debt (in billions of U.S. dollars) 4/ |
213.4 |
195.0 |
204.2 |
218.3 |
221.1 |
225.9 |
233.2 |
|
(In percent of GDP) |
63.1 |
65.7 |
68.8 |
69.4 |
62.5 |
61.0 |
58.7 |
|
Of which: short-term (in percent of total, original maturity) |
48.7 |
42.0 |
41.2 |
42.7 |
43.4 |
44.8 |
44.9 |
|
short-term (in percent of total, remaining maturity) |
69.4 |
65.7 |
63.7 |
64.7 |
65.1 |
66.0 |
66.0 |
|
Debt service ratio 4/ |
|||||||
|
(In percent of exports of goods and services) 7/ |
17.9 |
21.5 |
23.4 |
21.0 |
21.3 |
21.1 |
20.5 |
|
(In percent of exports of goods and nonfactor services) |
19.1 |
22.7 |
24.8 |
22.2 |
22.5 |
22.3 |
21.7 |
|
Memorandum items: |
|||||||
|
Nominal GDP (in billions of ringgit) |
1,106 |
1,159 |
1,231 |
1,353 |
1,427 |
1,522 |
1,633 |
|
Sources: Data provided by the authorities; CEIC Data Co. Ltd.; World Bank; UNESCO; and IMF,Integrated Monetary Database and staff estimates. |
|||||||
|
1/ Cash basis. The authorities plan to adopt accrual basis by 2021. For 2019, overall and primary balance includes the payment of outstanding tax refund (arrears) amounting to RM37 billion. |
|||||||
|
2/ Tax refunds in 2019 are allocated for payment of outstanding tax refunds. |
|||||||
|
3/ Consolidated public sector includes general government and nonfinancial public enterprises (NFPEs). General government includes federal government, state and local governments, and statutory bodies. |
|||||||
|
4/ IMF staff estimates. U.S. dollar values are estimated using official data published in national currency. |
|||||||
|
5/ Based on data provided by the authorities, but follows compilation methodology used in IMF'sIntegrated Monetary Database. |
|||||||
|
6/ Based on a broader measure of liquidity. Credit gap is estimated on quarterly data from 2000, using one-sided Hodrick-Prescott filter with a large parameter. |
|||||||
|
7/ Includes receipts under the primary income account. |
|||||||
-----
Earlier:

2018, December, 14, 08:45:00
MALAYSIA'S GDP UP BY 4.7%IMF - The Malaysian economy has shown resilience. Real GDP growth is projected at 4.7 percent for 2018, underpinned by domestic demand. |

2018, June, 1, 09:00:00
PETRONAS BUYS LNG CANADAREUTERS - Malaysia’s state-owned oil and gas company Petroliam Nasional Bhd [PETR.UL] said on Thursday it is buying a 25 percent stake in a Canadian liquefied natural gas (LNG) export project, nearly a year after cancelling its own planned terminal. |

2017, April, 6, 18:45:00
SOUTH CHINA SEA SOVEREIGNTYChina claims almost all of a large stretch of sea between Taiwan, Malaysia, Indonesia, the Philippines, Brunei, Vietnam and Japan. The trouble is, between them, these seven other states all do too. |

2017, March, 3, 18:35:00
MALAYSIA'S EXPORTS UP 13.6%Exports in January expanded 13.6 percent from a year earlier, the biggest gain since October 2015, but just missing the 15.0 percent increase forecast. In December, exports rose 10.7 percent. Data from the International Trade and Industry Ministry showed exports of mining goods increased 18.8 percent on stronger demand for crude oil and liquefied natural gas. |

2017, February, 28, 18:45:00
SAUDI BUYS PETRONAS: $7 BLNSaudi oil giant Aramco IPO-ARMO.SE will buy an equity stake in Malaysian firm Petronas' refining and petrochemicals project in the southeast Asian country, the companies confirmed on Tuesday, investing a total of $7 billion. |

2016, August, 31, 18:40:00
MALAYSIAN - INDONESIAN LNGIn recent years, given the huge potential in Indonesia LNG market, JSK has ventured into the LNG supply chain. Recently, it was awarded the LNG re-gasification and storage contracts to support a gas-fired power plant in Bali, Indonesia. Following the successful completion of the deal, Coastal Contracts would have joint control over JSK Gas’s operating subsidiaries and assets. JSK Gas, through its 99% owned subsidiary Benoa Gas Terminal (BGT), would be engaged in the operations and transfer of a floating LNG regasification unit over a five-year contract period. |

2016, May, 19, 20:10:00
PETRONAS PROFIT DOWN 60%Malaysia's national oil company (NOC) Petroliam Nasional Berhad (PETRONAS) posted a profit after tax of $1.1 billion (MYR 4.6 billion) for the first quarter of 2016 (1Q 2016) that ended March 31, down 60 percent from $2.8 billion (MYR 11.4 billion) recorded in the same period last year, while revenue fell 26 percent to $12.1 billion (MYR 49.1 billion) from $16.3 billion (MYR 66.2 billion) in the corresponding period, financial results released Wednesday by the firm showed. |


