2019-03-15 10:40:00
OPEC: OIL DEMAND GROWTH LESS
OPEC - Monthly Oil Market Report, 14 March 2019
Oil Market Highlights
Oil Price Movements
The OPEC Reference Basket (ORB) rose in February for the second consecutive month, improving by about 9%, or $5.09, month-on-month (m-o-m) to average $63.83/b. Oil prices were supported by expectations of tightening oil supply in the coming months amid increased unplanned outages. Crude oil futures prices continued their upward trend to reach levels not seen since last November. ICE Brent was $4.19, or 7.0%, m-o-m higher at $64.43/b, while NYMEX WTI rose by $3.43, or 6.7%, to average $54.98/b. Year-to-date (y-td) in February, ICE Brent was $5.25, or 7.8%, year-on-year (y-o-y) lower at $62.24/b, while NYMEX WTI decreased by $9.78, or 15.5%, y-o-y to $53.18/b. The ICE Brent price structure flattened at the front in of the curve, while backwardation strengthened at the back. DME Oman's backwardation remained significant in February. However, the NYMEX WTI price structure moved deeper into contango, mirroring US market oversupply. Hedge funds and other money managers continued to strengthen their bullish positions in ICE Brent, while decreasing their net long positions for NYMEX WTI.
World Economy
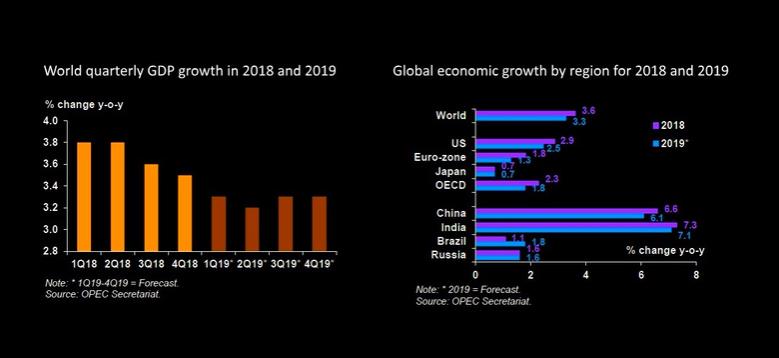
The global economic growth estimate remains unchanged at 3.6% in 2018 and is also forecast unchanged at 3.3% for 2019. In the OECD, US growth is unchanged at 2.9% in 2018 and projected at 2.5% for 2019. Eurozone growth remains at 1.8% in 2018 and is anticipated at 1.3% for 2019. GDP growth in Japan was revised lower to 0.7% for both 2018 and 2019. In the non-OECD countries, India's growth forecast was revised lower to 7.3% in 2018 and is now forecast at 7.1% for 2019, also showing a downward revision from the previous month's assessment. China's growth forecast remains at 6.6% in 2018 and 6.1% in 2019. Growth in Brazil remains unchanged at 1.1% in 2018 and is forecast at 1.8% in 2019. Russia's GDP growth forecast is also unchanged at 1.6% for both 2018 and 2019. Risks to global GDP growth continue to be skewed to the downside, as the slowing growth trend seems to be continuing in 1H19.
World Oil Demand
In 2018, world oil demand is estimated to have grown by 1.43 mb/d, down by 0.04 mb/d from the previous estimate amid downward revisions in both OECD and non-OECD regions. Oil demand growth in the OECD region was revised lower by 0.03 mb/d, due to softer-than-expected demand growth in OECD Europe and Asia Pacific during 4Q18 and despite solid data from OECD Americas, particularly the US. In the non-OECD region, oil demand growth in 2018 was also revised slightly lower by 0.02 mb/d, mainly reflecting the slower momentum in Other Asia and the Middle East. For 2019, world oil demand is forecast to grow by 1.24 mb/d, unchanged from last month's projections. As a result, total world oil demand is anticipated to reach 99.96 mb/d. Oil demand growth is projected to be driven by Other Asia particularly India, as well as China and OECD Americas. OECD countries are forecast to grow by 0.24 mb/d, while non-OECD oil demand is projected to rise by 1.00 mb/d in 2019.
World Oil Supply
Non-OPEC oil supply growth in 2018 was revised up by 0.03 mb/d from the previous MOMR, mainly due to higher-than-expected output in Canada in 4Q18, and is now estimated at 2.74 mb/d to average 62.19 mb/d. The main drivers for growth were the US, Canada, Russia, Kazakhstan and Qatar, while Mexico, Norway and Vietnam showed the largest declines. Non-OPEC oil supply growth in 2019 was also revised up by 0.06 mb/d, due to expected production increases in Canada as of April, as well as higher-than-expected growth in the Sudans. Non-OPEC supply growth in 2019 is forecast at 2.24 mb/d to average 64.43 mb/d. The US, Brazil, Russia, the UK and Australia are the main drivers, while Mexico, Norway, Indonesia and Vietnam are projected to see the largest declines. OPEC NGLs and non-conventional liquids are estimated to have grown by 0.04 mb/d in 2018, unchanged from the previous estimate to average 4.98 mb/d, and are forecast to grow by 0.09 mb/d in 2019 to average 5.07 mb/d. In February 2019, OPEC crude oil production decreased by 221 tb/d to average 30.55 mb/d, according to secondary sources.
Product Markets and Refining Operations
Global product markets reversed the downward trends and exhibited gains in February, after two consecutive months of weakening. In the US, all main products showed a solid positive performance as refinery product outputs declined considerably and led to a fall in inventory levels. In Europe, product markets saw increases across the barrel with the exception of naphtha, supported by inventory drawdowns amid lower product imports. In Asia, support came from the middle and the bottom of the barrel attributed to strong exports, despite prevailing weakness at the top of the barrel due to oversupply.
Tanker Market
In February, average dirty tanker spot freight rates declined further by 18%, continuing the downward trend seen a month earlier. Lower rates were seen on all reported dirty classes and most reported routes. The drop in rates came on the back of holidays in the East, reduced port and transit delays, thin market activity in general, and an increase in prompt vessels supply. Clean tanker spot freight rates were equally affected by the weakening trend and the general bearish sentiment.
Stock Movements
Preliminary data for January showed that total OECD commercial oil stocks rose by 22 mb m-o-m to stand at 2,880 mb. This was 4.3 mb higher than the same time one year ago and around 19 mb above the latest fiveyear average. Within the components, crude stocks indicated a surplus of 47 mb, while product stocks were 27 mb below the latest five-year average. In terms of days of forward cover, OECD commercial stocks rose by 0.5 days m-o-m in January to stand at 60.1 days. This was 0.3 days below the same period in 2018 and 0.9 days below the latest five-year average.
Balance of Supply and Demand
Demand for OPEC crude in 2018 is estimated at 31.5 mb/d, which is 1.4 mb/d lower than the 2017 level. In 2019, demand for OPEC crude is forecast at 30.5 mb/d, around 1.1 mb/d lower than the estimated 2018 level.
-----
Earlier:
2019, March, 13, 11:30:00
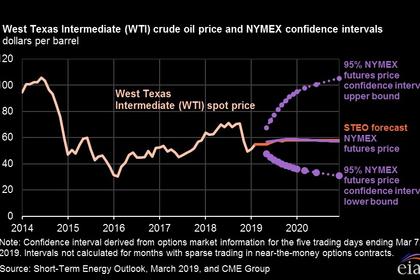
OIL PRICES 2019-20: $63-$62
Brent crude oil spot prices averaged $64 per barrel (b) in February, up $5/b from January 2019 and about $1/b lower than at the same time last year.


