2019-03-29 11:20:00


U.S. CURRENT ACCOUNT DEFICIT UP TO $134.4 billion
U.S. BEA - U.S. International Transactions, 4th quarter and Year 2018
Current-Account Balance
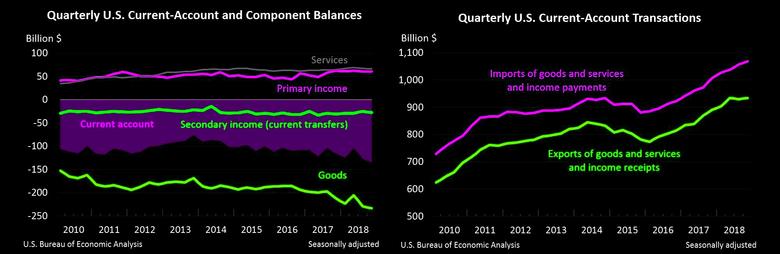
The U.S. current-account deficit increased to $134.4 billion (preliminary) in the fourth quarter of 2018 from $126.6 billion (revised) in the third quarter of 2018, according to statistics released by the Bureau of Economic Analysis (BEA). The deficit was 2.6 percent of current-dollar gross domestic product (GDP) in the fourth quarter, up from 2.5 percent in the third quarter.

The $7.8 billion increase in the current-account deficit mainly reflected increases in the deficits on goods and on secondary income and a decrease in the surplus on services.

Exports of goods and services and income receipts
Exports of goods and services and income receipts increased $4.1 billion in the fourth quarter to $934.3 billion.
- Primary income receipts increased $5.6 billion to $271.9 billion, primarily reflecting increases in portfolio investment income and in other investment income. A decrease in direct investment income partly offset the increases. For more information on direct investment income, see the box "Effects of the 2017 Tax Cuts and Jobs Act on Components of the International Transactions Accounts."
- Services exports increased $2.1 billion to $209.3 billion, mostly reflecting increases in other business services, primarily professional and management services, in travel (for all purposes including education), primarily personal travel, and in financial services.
- Goods exports decreased $3.7 billion to $416.1 billion, mainly reflecting a decrease in foods, feeds, and beverages, mostly soybeans.
Imports of goods and services and income payments
Imports of goods and services and income payments increased $11.8 billion in the fourth quarter to $1.1 trillion.
- Primary income payments increased $5.5 billion to $211.5 billion, mainly reflecting increases in other investment income and in portfolio investment income.
- Services imports increased $3.4 billion to $143.2 billion, mostly reflecting increases in travel (for all purposes including education), primarily personal travel, and in transport, primarily sea freight transport and air passenger transport.
- Secondary income payments increased $3.0 billion to $64.8 billion, mostly reflecting an increase in U.S. government grants.
Capital Account, Fourth Quarter (table 1)
Capital-transfer receipts were $8.9 billion in the fourth quarter. The transactions reflected receipts from foreign insurance companies for losses resulting from the wildfires in California. For information on transactions associated with natural disasters, see "What are the effects of hurricanes and other disasters on the international economic accounts?"
Financial Account, Fourth Quarter (tables 1, 6, 7, and 8)
Net U.S. borrowing measured by financial-account transactions was $168.3 billion in the fourth quarter, an increase from net borrowing of $36.8 billion in the third quarter.
Financial assets
Net U.S. acquisition of financial assets excluding financial derivatives increased $93.6 billion to $172.0 billion.
- Net U.S. acquisition of other investment assets was $223.2 billion following net U.S. liquidation of $52.0 billion in the third quarter. This change mostly reflected net U.S acquisition of currency and deposits and net U.S. provision of loans to foreign residents following net withdrawal of U.S. deposits from foreign banks and net foreign repayment of loans in the third quarter.
- Net U.S. sales of portfolio investment assets were $149.6 billion following net U.S. purchases of $70.1 billion in the third quarter. This change reflected net U.S. sales of both equity and debt instruments following net U.S. purchases in the third quarter.
- Net U.S. acquisition of direct investment assets increased $35.8 billion to $96.2 billion. For more information on recent transactions in direct investment assets, see the box "Effects of the 2017 Tax Cuts and Jobs Act on Components of the International Transactions Accounts."
Liabilities
Net U.S. incurrence of liabilities excluding financial derivatives increased $217.3 billion to $320.2 billion.
- Net U.S. incurrence of other investment liabilities was $244.9 billion following net U.S. repayment of $12.3 billion in the third quarter. This change primarily reflected net foreign provision of loans and net U.S. incurrence of currency and deposits following net U.S. repayment of loans and net foreign withdrawal in the third quarter.
Financial derivatives
Transactions in financial derivatives other than reserves reflected fourth-quarter net borrowing of $20.1 billion, a $7.8 billion increase in net borrowing from the third quarter.
Statistical Discrepancy, Fourth Quarter (table 1)
The statistical discrepancy was −$42.8 billion in the fourth quarter following a statistical discrepancy of $89.2 billion in the third quarter.
| Updates to Third Quarter 2018 International Transactions Accounts Aggregatess Billions of dollars, seasonally adjusted |
||
| Preliminary estimate | Revised estimate | |
| Current-account balance | –124.8 | –126.6 |
| Goods balance | –227.0 | –229.5 |
| Services balance | 68.4 | 67.5 |
| Primary-income balance | 59.4 | 60.3 |
| Secondary-income balance | –25.6 | –24.9 |
| Net lending (+)/borrowing (–) from financial-account transactions | –31.3 | –36.8 |
| Statistical discrepancy | 93.0 | 89.2 |
Current-Account Balance, Year 2018
The current-account deficit increased to $488.5 billion (preliminary) in 2018 from $449.1 billion in 2017. The deficit was 2.4 percent of current-dollar GDP in 2018, up from 2.3 percent in 2017.
The $39.3 billion increase in the deficit reflected an increase in the deficit on goods that was partly offset by increases in the surpluses on primary income and on services and a decrease in the deficit on secondary income.
Current-Account Transactions, Year 2018 (tables 1-5)
Exports of goods and services and income receipts
Exports of goods and services and income receipts increased $268.5 billion in 2018 to $3.7 trillion.
- Primary income receipts increased $132.2 billion to $1.1 trillion, led by increases in portfolio investment income and in direct investment income.
- Goods exports increased $118.9 billion to $1.7 trillion, led by an increase in industrial supplies and materials, primarily petroleum and products.
- Services exports increased $30.7 billion to $0.8 trillion, led by an increase in other business services.
Imports of goods and services and income payments
Imports of goods and services and income payments increased $307.8 billion to $4.2 trillion.
- Goods imports increased $202.8 billion to $2.6 trillion, led by increases in industrial supplies and materials, in capital goods, and in consumer goods.
- Primary income payments increased $109.7 billion to $0.8 trillion, led by an increase in other investment income.
Capital Account, Year 2018 (table 1)
Capital-transfer receipts were $9.4 billion in 2018. The transactions reflected receipts from foreign insurance companies for losses resulting from Hurricane Florence and the wildfires in California. For more information, see "What are the effects of hurricanes and other disasters on the international economic accounts?”
Financial Account, Year 2018 (tables 1, 6, 7, and 8)
Net U.S. borrowing measured by financial-account transactions was $519.6 billion in 2018, an increase from net borrowing of $331.9 billion in 2017.
Financial assets
Net U.S. acquisition of financial assets excluding financial derivatives decreased $881.1 billion to $301.6 billion.
- Net U.S. withdrawal of direct investment assets was $50.6 billion following net U.S. acquisition of $379.2 billion in 2017. The net withdrawal of direct investment assets reflected U.S. parent repatriation of previously reinvested earnings in response to the TCJA. For more information, see the box "Effects of the 2017 Tax Cuts and Jobs Act on Components of the International Transactions Accounts."
- Net U.S. purchases of portfolio investment assets decreased $376.4 billion to $210.3 billion, mostly reflecting a decrease in net U.S. purchases of foreign debt securities.
- Net U.S. acquisition of other investment assets decreased $81.6 billion to $136.9 billion. This change mostly reflected net foreign repayment of loans following net U.S. provision in 2017.
Liabilities
Net U.S. incurrence of liabilities excluding financial derivatives decreased $736.8 billion to $800.9 billion.
- Net foreign purchases of portfolio investment liabilities decreased $479.2 billion to $320.0 billion, mostly reflecting a decrease in net foreign purchases of U.S. bonds."
- Net U.S. incurrence of other investment liabilities decreased $169.8 billion to $213.8 billion, mainly reflecting a decrease in net U.S. incurrence of currency and deposits.
- Net U.S. incurrence of direct investment liabilities decreased $87.7 billion to $267.1 billion, mainly reflecting net U.S. repayment of debt liabilities following net U.S. incurrence in 2017.
Financial derivatives
Transactions in financial derivatives other than reserves reflected net borrowing of $20.3 billion in 2018 following net lending of $23.1 billion in 2017.
Statistical Discrepancy, Year 2018 (table 1)
The statistical discrepancy was −$40.5 billion in 2018 following a statistical discrepancy of $92.5 billion in 2017.
-----
Earlier:
2019, March, 27, 11:55:00
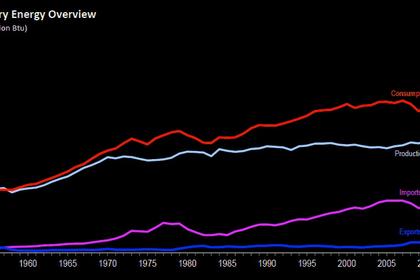
U.S. ENERGY CONSUMPTION UP
U.S. primary energy consumption totaled 101 quadrillion British thermal units (Btu). This total was the highest since at least 1949, the earliest year for which EIA has data.
2019, March, 22, 10:05:00
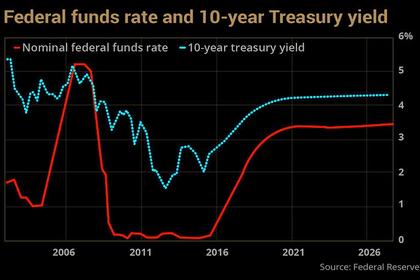
U.S. FEDERAL FUNDS RATE 2.25-2.5%
U.S. FRB - Consistent with its statutory mandate, the Committee seeks to foster maximum employment and price stability. In support of these goals, the Committee decided to maintain the target range for the federal funds rate at 2-1/4 to 2-1/2 percent.
2019, March, 18, 12:35:00
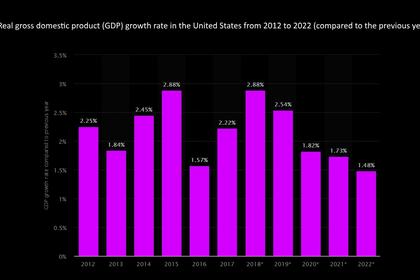
U.S. GDP UP 3.1%
U.S. DT - During 2018, real GDP increased by 3.1 percent measured from the fourth quarter of 2017 to the fourth quarter of 2018.
2019, March, 18, 12:30:00
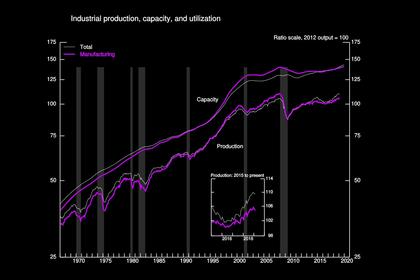
U.S. INDUSTRIAL PRODUCTION UP 0.1%
U.S. FRB - Industrial production edged up 0.1 percent in February after decreasing 0.4 percent in January.
2019, March, 11, 11:05:00
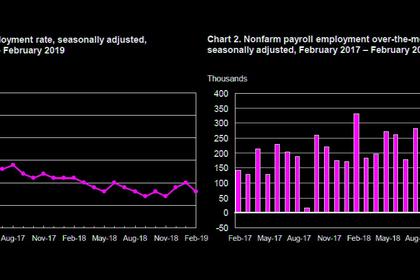
U.S. UNEMPLOYMENT DOWN TO 3.8%
U.S. BLS - Total nonfarm payroll employment changed little in February (+20,000), and the unemployment rate declined to 3.8 percent, the U.S. Bureau of Labor Statistics
reported. Employment in professional and business services, health care, and wholesale trade continued to trend up, while construction employment decreased.


