2019-03-20 10:20:00


U.S. RENEWABLE UP
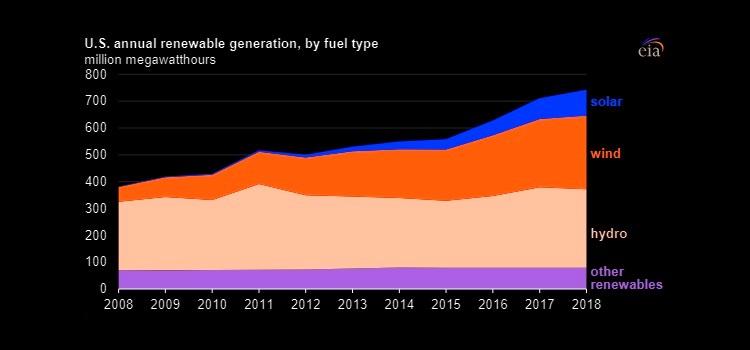
EIA - Renewable generation provided a new record of 742 million megawatthours (MWh) of electricity in 2018, nearly double the 382 million MWh produced in 2008. Renewables provided 17.6% of electricity generation in the United States in 2018.
Nearly 90% of the increase in U.S. renewable electricity between 2008 and 2018 came from wind and solar generation. Wind generation rose from 55 million MWh in 2008 to 275 million MWh in 2018 (6.5% of total electricity generation), exceeded only by conventional hydroelectric at 292 million MWh (6.9% of total generation).
U.S. solar generation has increased from 2 million MWh in 2008 to 96 million MWh in 2018. Solar generation accounted for 2.3% of electricity generation in 2018. Solar generation is generally categorized as small-scale (customer-sited or rooftop) solar installations or utility-scale installations. In 2018, 69% of solar generation, or 67 million MWh, was utility-scale solar.

Increases in U.S. wind and solar generation are driven largely by capacity additions. In 2008, the United States had 25 gigawatts (GW) of wind generating capacity. By the end of 2018, 94 GW of wind generating capacity was operating on the electric grid. Almost all of this capacity is onshore; one offshore wind plant, located on Block Island, off the coast of Rhode Island, has a capacity of 30 megawatts. Similarly, installed solar capacity grew from an estimated less than 1 GW in 2008 to 51 GW in 2018. In 2018, 1.8 GW of this solar capacity was solar thermal, 30 GW was utility-scale solar photovoltaics (PV), and the remaining 20 GW was small-scale solar PV.
Growth in renewable technologies in the United States, particularly in wind and solar, has been driven by federal and state policies and declining costs. Federal policies such as the American Reinvestment and Recovery Act of 2009 and the Production Tax Credit and Investment Tax Credits for wind and solar have spurred project development.
In addition, state-level policies, such as renewable portfolio standards, which require a certain share of electricity to come from renewable sources, have increasing targets over time. As more wind and solar projects have come online, economies of scale have led to more efficient project development and financing mechanisms, which has led to continued cost declines.
Conventional hydroelectric capacity has remained relatively unchanged in the United States, increasing by 2% since 2008. Changes in hydroelectric generation year-over-year typically reflect changes in precipitation and drought conditions. Between 2008 and 2018, annual U.S. hydroelectric generation was as low as 249 million MWh and as high as 319 million MWh, with hydroelectric generation in 2018 totaling 292 million MWh. Generation from other renewable resources, including biomass and geothermal, increased from 70 million MWh to 79 million MWh in the United States between 2008 and 2018, and it collectively represented 1.9% of total generation in 2018.
-----
Earlier:

2019, February, 20, 11:20:00
RENEWABLE ENERGY INNOVATIONSIRENA - Innovative solutions accelerate low-cost renewables in the power sector, providing countries with tools to benefit from renewables scale-up, new IRENA report finds |

2019, February, 15, 11:50:00
BP ENERGY OUTLOOK 2019BP - The 2019 edition of BP’s Energy Outlook, published today, explores the key uncertainties that could impact the shape of global energy markets out to 2040. The greatest uncertainties over this period involve the need for more energy to support continued global economic growth and rising prosperity, together with the need for a more rapid transition to a lower-carbon future. |

2019, January, 28, 10:05:00
U.S. ENERGY OUTLOOK 2019EIA - U.S. crude oil production continues to set annual records through the mid-2020s and remains greater than 14.0 million barrels per day (b/d) through 2040. The continued development of tight oil and shale gas resources, particularly those in the East and Southwest regions, supports growth in NGPL production—which reaches 6.0 million b/d by 2030—and dry natural gas production. Dry natural gas production reaches 43.4 trillion cubic feet by 2050. |

2019, January, 21, 11:20:00
FASTEST RENEWABLE GROWINGU.S. EIA - EIA expects non-hydroelectric renewable energy resources such as solar and wind will be the fastest growing source of U.S. electricity generation for at least the next two years. |

2018, December, 24, 12:00:00
U.S. PRIMARY ENERGY PRODUCTION 8.0 QUADRILLION BTUU.S. EIA - U.S. primary energy production totaled 8.0 quadrillion British thermal units (Btu), a 10% increase compared with September 2017. |

2018, December, 7, 08:10:00
WBG GREEN INVESTMENT $200 BLNWBG - “There are literally trillions of dollars of opportunities for the private sector to invest in projects that will help save the planet,” said IFC CEO Philippe Le Houérou. “Our job is to go out and proactively find those opportunities, use our de-risking tools, and crowd in private sector investment. We will do much more in helping finance renewable energy, green buildings, climate-smart agribusiness, urban transportation, water, and urban waste management.” |

2018, July, 23, 13:25:00
GLOBAL ENERGY INVESTMENT DOWN 2%IEA - For the third consecutive year, global energy investment declined, to USD 1.8 trillion (United States dollars) in 2017 – a fall of 2% in real terms. The power generation sector accounted for most of this decline, due to fewer additions of coal, hydro and nuclear power capacity, which more than offset increased investment in solar photovoltaics. |


