2019-03-18 12:20:00
U.S. RIGS DOWN 1 TO 1,026
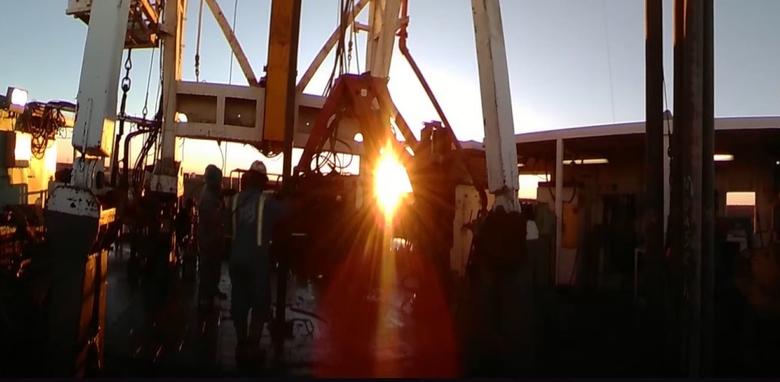
BHGE - U.S. Rig Count is down 1 rig from last week to 1,026 rigs, with oil rigs down 1 to 833 and gas rigs unchanged at 193.
U.S. Rig Count is up 36 rigs from last year's count of 990, with oil rigs up 33 and gas rigs up 4.
The U.S. Offshore Rig Count is unchanged at 22 rigs and up 9 rigs year-over-year.
Canada Rig Count is down 28 rigs from last week to 161, with oil rigs down 20 to 98 and gas rigs down 8 to 63.
Canada Rig Count is down 58 rigs from last year's count of 219, with oil rigs down 46 and gas rigs down 12.
| Rotary Rig Count | |||||||||
| 3/15/19 | |||||||||
| Week | Year | ||||||||
| Location | Week | +/- | Ago | +/- | Ago | ||||
| Land | 1001 | -3 | 1004 | 28 | 973 | ||||
| Inland Waters | 3 | 2 | 1 | -1 | 4 | ||||
| Offshore | 22 | 0 | 22 | 9 | 13 | ||||
| United States Total | 1026 | -1 | 1027 | 36 | 990 | ||||
| Gulf Of Mexico | 22 | 0 | 22 | 9 | 13 | ||||
| Canada | 161 | -28 | 189 | -58 | 219 | ||||
| North America | 1187 | -29 | 1216 | -22 | 1209 | ||||
| U.S. Breakout Information | This Week | +/- | Last Week | +/- | Year Ago | ||||
| Oil | 833 | -1 | 834 | 33 | 800 | ||||
| Gas | 193 | 0 | 193 | 4 | 189 | ||||
| Miscellaneous | 0 | 0 | 0 | -1 | 1 | ||||
| Directional | 65 | -2 | 67 | -3 | 68 | ||||
| Horizontal | 907 | 3 | 904 | 42 | 865 | ||||
| Vertical | 54 | -2 | 56 | -3 | 57 | ||||
| Canada Breakout Information | This Week | +/- | Last Week | +/- | Year Ago | ||||
| Oil | 98 | -20 | 118 | -46 | 144 | ||||
| Gas | 63 | -8 | 71 | -12 | 75 | ||||
| Major State Variances | This Week | +/- | Last Week | +/- | Year Ago | ||||
| Alaska | 10 | 3 | 7 | 3 | 7 | ||||
| Arkansas | 0 | 0 | 0 | -1 | 1 | ||||
| California | 15 | 0 | 15 | 1 | 14 | ||||
| Colorado | 34 | 0 | 34 | 5 | 29 | ||||
| Louisiana | 65 | -1 | 66 | 8 | 57 | ||||
| New Mexico | 106 | 1 | 105 | 18 | 88 | ||||
| North Dakota | 56 | 3 | 53 | 3 | 53 | ||||
| Ohio | 13 | 0 | 13 | -10 | 23 | ||||
| Oklahoma | 111 | -5 | 116 | -13 | 124 | ||||
| Pennsylvania | 47 | 0 | 47 | 7 | 40 | ||||
| Texas | 501 | -1 | 502 | 9 | 492 | ||||
| Utah | 8 | 0 | 8 | -1 | 9 | ||||
| West Virginia | 19 | 0 | 19 | 2 | 17 | ||||
| Wyoming | 36 | 0 | 36 | 6 | 30 | ||||
| Major Basin Variances | This Week | +/- | Last Week | +/- | Year Ago | ||||
| Ardmore Woodford | 5 | 0 | 5 | 4 | 1 | ||||
| Arkoma Woodford | 4 | -1 | 5 | -3 | 7 | ||||
| Barnett | 1 | 0 | 1 | -1 | 2 | ||||
| Cana Woodford | 53 | -5 | 58 | -11 | 64 | ||||
| DJ-Niobrara | 31 | 0 | 31 | 8 | 23 | ||||
| Eagle Ford | 82 | 1 | 81 | 11 | 71 | ||||
| Fayetteville | 0 | 0 | 0 | -1 | 1 | ||||
| Granite Wash | 6 | -1 | 7 | -8 | 14 | ||||
| Haynesville | 58 | 0 | 58 | 6 | 52 | ||||
| Marcellus | 65 | 0 | 65 | 9 | 56 | ||||
| Mississippian | 5 | -3 | 8 | 1 | 4 | ||||
| Permian | 464 | -1 | 465 | 27 | 437 | ||||
| Utica | 14 | 0 | 14 | -10 | 24 | ||||
| Williston | 56 | 3 | 53 | 2 | 54 | ||||
-----
Earlier:
2019, March, 15, 10:35:00
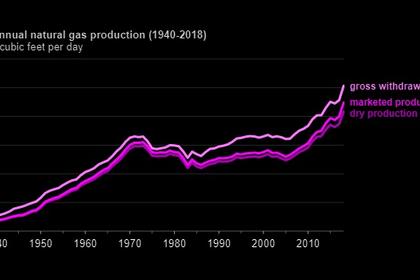
U.S. GAS PRODUCTION RECORD
U.S. natural gas production grew by 10.0 billion cubic feet per day (Bcf/d) in 2018, an 11% increase from 2017. The growth was the largest annual increase in production on record, reaching a record high for the second consecutive year


