2019-03-25 10:35:00
U.S. RIGS DOWN 10 TO 1,016
BHGE - U.S. Rig Count is down 10 rigs from last week to 1,016, with oil rigs down 9 to 824 and gas rigs down 1 to 192.
U.S. Rig Count is up 21 rigs from last year's count of 995, with oil rigs up 20, gas rigs up 2, and miscellaneous rigs down 1 to 0.
The U.S. Offshore Rig Count is down 2 rigs to 20 and up 7 rigs year-over-year.
Canada Rig Count is down 56 rigs from last week to 105, with oil rigs down 49 to 49 and gas rigs down 7 to 56.
Canada Rig Count is down 56 rigs from last year's count of 161, with oil rigs down 44 and gas rigs down 12.
| Rotary Rig Count | |||||||||
| 3/22/19 | |||||||||
| Week | Year | ||||||||
| Location | Week | +/- | Ago | +/- | Ago | ||||
| Land | 993 | -8 | 1001 | 14 | 979 | ||||
| Inland Waters | 3 | 0 | 3 | 0 | 3 | ||||
| Offshore | 20 | -2 | 22 | 7 | 13 | ||||
| United States Total | 1016 | -10 | 1026 | 21 | 995 | ||||
| Gulf Of Mexico | 20 | -2 | 22 | 7 | 13 | ||||
| Canada | 105 | -56 | 161 | -56 | 161 | ||||
| North America | 1121 | -66 | 1187 | -35 | 1156 | ||||
| U.S. Breakout Information | This Week | +/- | Last Week | +/- | Year Ago | ||||
| Oil | 824 | -9 | 833 | 20 | 804 | ||||
| Gas | 192 | -1 | 193 | 2 | 190 | ||||
| Miscellaneous | 0 | 0 | 0 | -1 | 1 | ||||
| Directional | 63 | -2 | 65 | 1 | 62 | ||||
| Horizontal | 900 | -7 | 907 | 30 | 870 | ||||
| Vertical | 53 | -1 | 54 | -10 | 63 | ||||
| Canada Breakout Information | This Week | +/- | Last Week | +/- | Year Ago | ||||
| Oil | 49 | -49 | 98 | -44 | 93 | ||||
| Gas | 56 | -7 | 63 | -12 | 68 | ||||
| Major State Variances | This Week | +/- | Last Week | +/- | Year Ago | ||||
| Alaska | 9 | -1 | 10 | 0 | 9 | ||||
| Arkansas | 0 | 0 | 0 | -1 | 1 | ||||
| California | 15 | 0 | 15 | 1 | 14 | ||||
| Colorado | 34 | 0 | 34 | 3 | 31 | ||||
| Louisiana | 62 | -3 | 65 | 5 | 57 | ||||
| New Mexico | 104 | -2 | 106 | 16 | 88 | ||||
| North Dakota | 57 | 1 | 56 | 4 | 53 | ||||
| Ohio | 14 | 1 | 13 | -8 | 22 | ||||
| Oklahoma | 109 | -2 | 111 | -11 | 120 | ||||
| Pennsylvania | 48 | 1 | 47 | 8 | 40 | ||||
| Texas | 497 | -4 | 501 | -2 | 499 | ||||
| Utah | 8 | 0 | 8 | 1 | 7 | ||||
| West Virginia | 18 | -1 | 19 | 1 | 17 | ||||
| Wyoming | 36 | 0 | 36 | 6 | 30 | ||||
| Major Basin Variances | This Week | +/- | Last Week | +/- | Year Ago | ||||
| Ardmore Woodford | 5 | 0 | 5 | 4 | 1 | ||||
| Arkoma Woodford | 3 | -1 | 4 | -4 | 7 | ||||
| Barnett | 1 | 0 | 1 | -1 | 2 | ||||
| Cana Woodford | 52 | -1 | 53 | -7 | 59 | ||||
| DJ-Niobrara | 31 | 0 | 31 | 7 | 24 | ||||
| Eagle Ford | 82 | 0 | 82 | 10 | 72 | ||||
| Fayetteville | 0 | 0 | 0 | -1 | 1 | ||||
| Granite Wash | 6 | 0 | 6 | -7 | 13 | ||||
| Haynesville | 57 | -1 | 58 | 5 | 52 | ||||
| Marcellus | 65 | 0 | 65 | 9 | 56 | ||||
| Mississippian | 5 | 0 | 5 | 2 | 3 | ||||
| Permian | 459 | -5 | 464 | 15 | 444 | ||||
| Utica | 15 | 1 | 14 | -8 | 23 | ||||
| Williston | 57 | 1 | 56 | 3 | 54 | ||||
-----
Earlier:
2019, March, 22, 10:25:00
U.S. OIL PRODUCTION 12.1 MBD
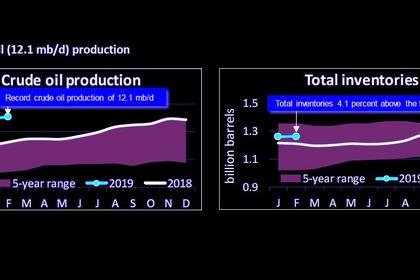
U.S set a new record for oil production at 12.1 million barrels a day (mb/d) in February, continuing America’s position as the world’s leading oil producer.
2019, March, 22, 10:20:00
U.S. OIL INVENTORIES DOWN 9.6 MB
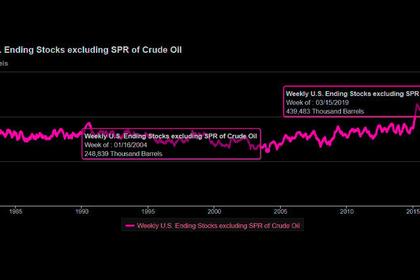
US crude oil inventories for the week ended Mar. 15, excluding the Strategic Petroleum Reserve, decreased 9.6 million bbl from the previous week, data from the US Energy Information Administration showed.
2019, March, 20, 11:00:00
U.S. PRODUCTION: OIL + 85 TBD, GAS + 883 MCFD
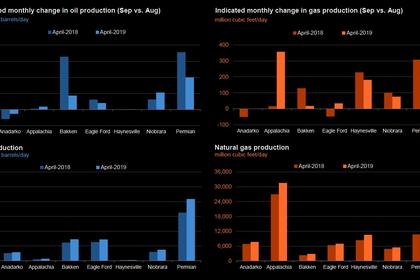
U.S. EIA - Crude oil production from the major US onshore regions is forecast to increase 85,000 b/d month-over-month in April from 8,507 to 8,592 thousand barrels/day , gas production to increase 883 million cubic feet/day from 78,137 to 79,020 million cubic feet/day .

2019, March, 18, 12:20:00
U.S. RIGS DOWN 1 TO 1,026
BHGE -U.S. Rig Count is down 1 rig from last week to 1,026 rigs, with oil rigs down 1 to 833 and gas rigs unchanged at 193. Canada Rig Count is down 28 rigs from last week to 161, with oil rigs down 20 to 98 and gas rigs down 8 to 63.


