2019-03-29 11:15:00


U.S. TRADE DEFICIT $51.1 BLN
U.S. BEA - U.S. International Trade in Goods and Services, January 2019
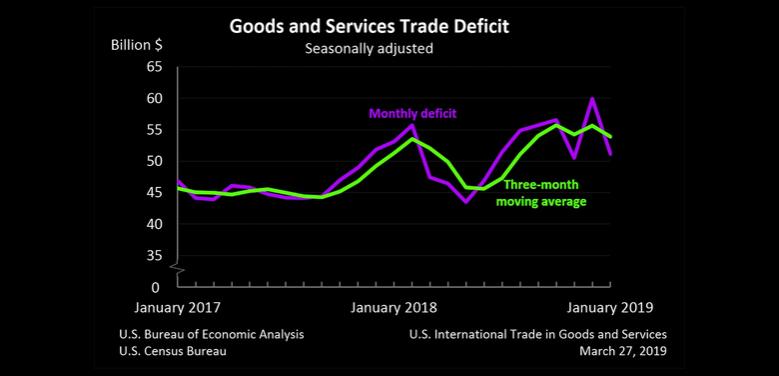
The U.S. Census Bureau and the U.S. Bureau of Economic Analysis announced today that the goods and services deficit was $51.1 billion in January, down $8.8 billion from $59.9 billion in December, revised.
| Deficit: | $51.1 Billion | -14.6%° |
| Exports: | $207.3 Billion | +0.9%° |
| Imports: | $258.5 Billion | -2.6%° |
|
Next release: April 17, 2019 (°) Statistical significance is not applicable or not measurable. Data adjusted for seasonality but not price changes Source: U.S. Census Bureau, U.S. Bureau of Economic Analysis; U.S. International Trade in Goods and Services, March 27, 2019 |
||
Exports, Imports, and Balance (exhibit 1)
January exports were $207.3 billion, $1.9 billion more than December exports. January imports were $258.5 billion, $6.8 billion less than December imports.
The January decrease in the goods and services deficit reflected a decrease in the goods deficit of $8.2 billion to $73.3 billion and an increase in the services surplus of $0.5 billion to $22.1 billion.
Year-over-year, the goods and services deficit decreased $1.9 billion, or 3.7 percent, from January 2018. Exports increased $6.1 billion or 3.0 percent. Imports increased $4.1 billion or 1.6 percent.
Three-Month Moving Averages (exhibit 2)
The average goods and services deficit decreased $1.8 billion to $53.9 billion for the three months ending in January.
- Average exports decreased $1.1 billion to $207.4 billion in January.
- Average imports decreased $2.9 billion to $261.2 billion in January.
Year-over-year, the average goods and services deficit increased $2.5 billion from the three months ending in January 2018.
- Average exports increased $4.5 billion from January 2018.
- Average imports increased $7.0 billion from January 2018.
Exports (exhibits 3, 6, and 7)
Exports of goods increased $1.8 billion to $137.4 billion in January.
Exports of goods on a Census basis increased $1.8 billion.
- Foods, feeds, and beverages increased $1.3 billion.
- Soybeans increased $0.9 billion.
- Automotive vehicles, parts, and engines increased $1.2 billion.
- Passenger cars increased $0.7 billion.
- Capital goods decreased $0.8 billion.
- Civilian aircraft decreased $1.3 billion.
Net balance of payments adjustments decreased less than $0.1 billion.
Exports of services increased $0.2 billion to $70.0 billion in January.
- Other business services, which includes research and development services; professional and management services; and technical, trade-related, and other services, increased $0.1 billion.
- Transport increased $0.1 billion.
Imports (exhibits 4, 6, and 8)
Imports of goods decreased $6.5 billion to $210.7 billion in January.
Imports of goods on a Census basis decreased $6.5 billion.
- Capital goods decreased $3.0 billion.
- Computer accessories decreased $0.9 billion.
- Semiconductors decreased $0.7 billion.
- Civilian aircraft decreased $0.7 billion.
- Industrial supplies and materials decreased $2.3 billion.
- Crude oil decreased $1.4 billion.
Net balance of payments adjustments decreased less than $0.1 billion.
Imports of services decreased $0.3 billion to $47.8 billion in January.
- Transport decreased $0.2 billion.
- Travel (for all purposes including education) decreased $0.2 billion.
- Other business services increased $0.1 billion.
Real Goods in 2012 Dollars – Census Basis (exhibit 11)
The real goods deficit decreased $7.8 billion to $83.8 billion in January.
- Real exports of goods increased $3.1 billion to $149.7 billion.
- Real imports of goods decreased $4.8 billion to $233.6 billion.
Revisions
Exports and imports of goods and services were revised for July through December 2018 to incorporate more comprehensive and updated quarterly and monthly data. In addition to these revisions, seasonally adjusted data for all months in 2018 were revised so that the totals of the seasonally adjusted months equal the annual totals.
Revisions to December exports
- Exports of goods were revised down less than $0.1 billion.
- Exports of services were revised up $0.3 billion.
Revisions to December imports
- Imports of goods were revised down less than $0.1 billion.
- Imports of services were revised up $0.4 billion.
Goods by Selected Countries and Areas: Monthly – Census Basis (exhibit 19)
The January figures show surpluses, in billions of dollars, with South and Central America ($4.5), United Kingdom ($2.0), Hong Kong ($1.8), Canada ($1.4), and Brazil ($1.1). Deficits were recorded, in billions of dollars, with China ($33.2), European Union ($13.1), Mexico ($7.2), Germany ($6.0), Japan ($5.3), Italy ($2.9), South Korea ($2.4), Taiwan ($2.2), India ($1.9), France ($1.2), OPEC ($0.2), Saudi Arabia ($0.1), and Singapore (less than $0.1).
- The deficit with China decreased $5.5 billion to $33.2 billion in January. Exports decreased $0.2 billion to $7.5 billion and imports decreased $5.7 billion to $40.8 billion.
- The balance with Canada shifted from a deficit of $0.7 billion to a surplus of $1.4 billion in January. Exports increased $0.4 billion to $24.4 billion and imports decreased $1.6 billion to $23.0 billion.
- The deficit with South Korea increased $0.7 billion to $2.4 billion in January. Exports decreased $1.1 billion to $4.2 billion and imports decreased $0.4 billion to $6.6 billion.
Goods and Services by Selected Countries and Areas: Quarterly – Balance of Payments Basis (exhibit 20)
Statistics on trade in goods and services by country and area are only available quarterly, with a one-month lag. With this release, fourth-quarter figures are now available.
The fourth-quarter figures show surpluses, in billions of dollars, with South and Central America ($21.2), Hong Kong ($8.1), Brazil ($7.4), United Kingdom ($4.9), Singapore ($4.8), Canada ($1.5), and OPEC ($0.6). Deficits were recorded, in billions of dollars, with China ($102.6), European Union ($28.7), Mexico ($21.4), Germany ($16.3), Japan ($14.1), Italy ($9.4), India ($5.8), Taiwan ($3.9), France ($3.0), Saudi Arabia ($2.7), and South Korea ($1.8).
- The deficit with China increased $6.3 billion to $102.6 billion in the fourth quarter. Exports decreased $8.2 billion to $37.2 billion and imports decreased $1.9 billion to $139.8 billion.
- The deficit with Taiwan increased $1.9 billion to $3.9 billion in the fourth quarter. Exports decreased $0.7 billion to $10.6 billion and imports increased $1.2 billion to $14.5 billion.
- The balance with Canada shifted from a deficit of $3.4 billion to a surplus of $1.5 billion in the fourth quarter. Exports decreased $0.8 billion to $89.1 billion and imports decreased $5.8 billion to $87.6 billion.
-----
Earlier:
2019, March, 27, 11:55:00
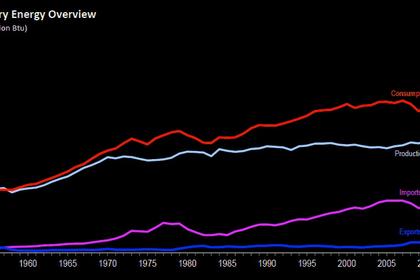
U.S. ENERGY CONSUMPTION UP
U.S. primary energy consumption totaled 101 quadrillion British thermal units (Btu). This total was the highest since at least 1949, the earliest year for which EIA has data.
2019, March, 22, 10:05:00
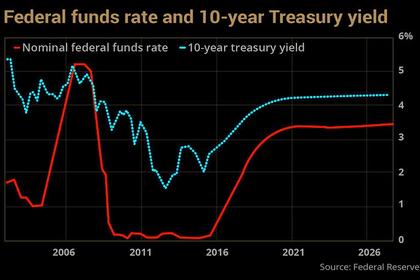
U.S. FEDERAL FUNDS RATE 2.25-2.5%
U.S. FRB - Consistent with its statutory mandate, the Committee seeks to foster maximum employment and price stability. In support of these goals, the Committee decided to maintain the target range for the federal funds rate at 2-1/4 to 2-1/2 percent.
2019, March, 18, 12:35:00
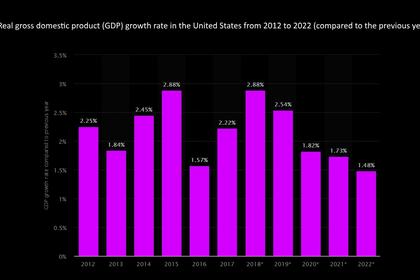
U.S. GDP UP 3.1%
U.S. DT - During 2018, real GDP increased by 3.1 percent measured from the fourth quarter of 2017 to the fourth quarter of 2018.
2019, March, 18, 12:30:00
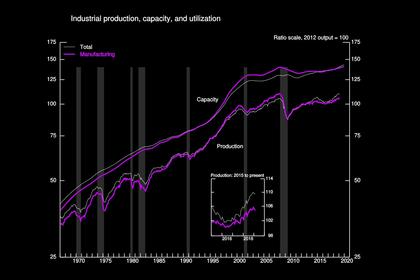
U.S. INDUSTRIAL PRODUCTION UP 0.1%
U.S. FRB - Industrial production edged up 0.1 percent in February after decreasing 0.4 percent in January.
2019, March, 11, 11:05:00
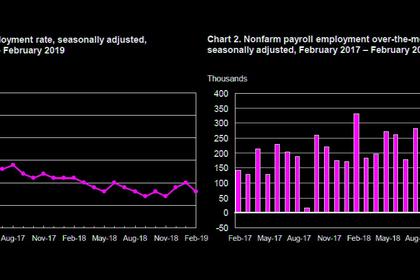
U.S. UNEMPLOYMENT DOWN TO 3.8%
U.S. BLS - Total nonfarm payroll employment changed little in February (+20,000), and the unemployment rate declined to 3.8 percent, the U.S. Bureau of Labor Statistics
reported. Employment in professional and business services, health care, and wholesale trade continued to trend up, while construction employment decreased.


