U.S. GAS EXPORTS UP

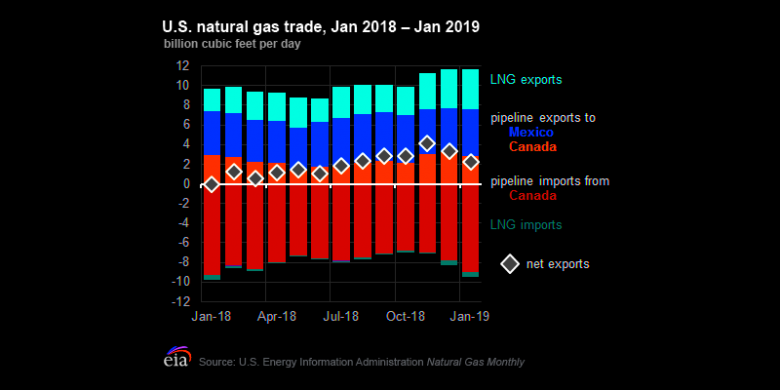
U.S. EIA - U.S. net natural gas exports in January 2019 totaled 2.3 billion cubic feet per day (Bcf/d), marking 12 consecutive months where U.S. natural gas exports exceeded U.S. imports. Preliminary data from PointLogic Energy indicate that this trend continued through February and March 2019. Exports from the United States via pipeline to both Canada and Mexico, as well as U.S. exports of liquefied natural gas (LNG), were all at or near record highs as of January 2019.
U.S. LNG exports totaled 4.1 Bcf/d in January 2019, marking the third consecutive month where a new record high was reached. The volume of U.S. LNG exports rose steadily during 2018 as three new liquefaction units, called trains, totaling 1.9 Bcf/d capacity, entered service:
- A single train at the Cove Point terminal in March 2018
- Train 5 at the Sabine Pass terminal in November 2018
- Train 1 at the Corpus Christi terminal in December 2018
LNG export volumes are expected to continue to rise in 2019 as an additional 4 Bcf/d of liquefaction capacity is brought online by the end of the year.
U.S. exports via pipeline to Canada, which had been lower in recent years, have risen since November 2018, when both the second phase of the Rover pipeline and the NEXUS pipeline entered service. These two projects bring low-cost natural gas from the Marcellus and Utica plays to the Dawn Hub in Ontario, Canada. U.S. exports to Canada in January 2019 were 2.8 Bcf/d, down from 3.2 Bcf/d in December 2018―the highest volume observed since December 2012.
U.S. pipeline exports of natural gas to Mexico in January 2019 were 4.8 Bcf/d, a year-on-year increase of almost 0.4 Bcf/d. Much of the year-on-year growth is attributed to increased U.S. exports out of the Permian Basin in western Texas as new pipelines and natural gas-fired power plant projects within Mexico entered service. In addition, several existing pipelines in southeastern Texas completed expansions during the past 12 months, increasing cross-border capacity.
EIA's Short Term Energy Outlook forecasts U.S. net natural gas exports to average 5.6 Bcf/d in 2019 and grow by another 50% in 2020, led mostly by the growth in LNG exports as three new LNG facilities will be commissioned in the next two years.
Overview:
(For the week ending Wednesday, March 3, 2019)
- Natural gas spot price movements were mixed this report week (Wednesday, March 27 to Wednesday, April 3). Henry Hub spot prices rose from $2.66 per million British thermal units (MMBtu) last Wednesday to $2.67/MMBtu yesterday.
- At the Nymex, the April 2019 contract expired last Wednesday at $2.713/MMBtu. The May 2019 contract decreased to $2.677/MMBtu, down 4¢/MMBtu from last Wednesday to yesterday. The price of the 12-month strip averaging May 2019 through April 2020 futures contracts declined 4¢/MMBtu to $2.846/MMBtu.
- Net injections to working gas totaled 23 billion cubic feet (Bcf) for the week ending March 29. Working natural gas stocks are 1,130 Bcf, which is 17% lower than the year-ago level and 31% lower than the five-year (2014–18) average for this week.
- According to Baker Hughes, for the week ending Tuesday, March 26, the natural gas rig count decreased by 2 to 190. The number of oil-directed rigs fell by 8 to 816. The total rig count decreased by 10, and it now stands at 1,006.
-----
Earlier:


