2019-04-19 09:40:00
U.S. OIL PRODUCTION 12.1 MBD
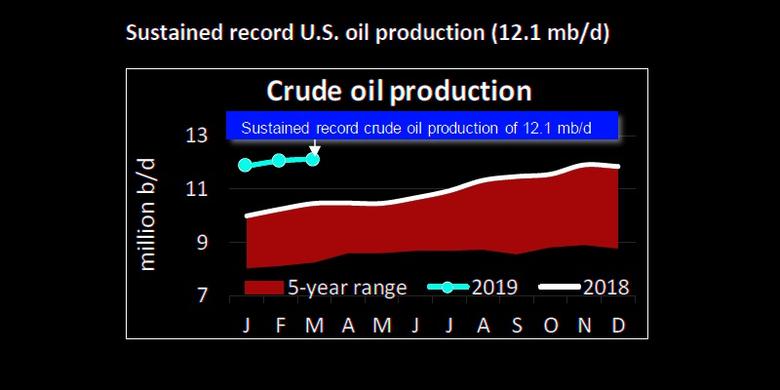
U.S. API - the American Petroleum Institute's latest monthly statistical report showed that the U.S. sustained its position as the world's leading oil producer, continuing a pace of 12.1 million barrels a day (mb/d), matching February 2019. In addition, petroleum demand in March was the strongest for that month in more than a decade at 20.7 mb/d.
"Robust and record levels of U.S. natural gas and oil production continue to lead the world and have played a predominant role in meeting increased global demand for gasoline, distillate and jet fuel," said API Chief Economist Dean Foreman. "However, from this strong point of departure the pace of market growth also slowed in March, which highlights the importance of enhancing America's infrastructure and market access. To continue this success story, we need to focus on policies that foster access to resources, investment in domestic and export infrastructure, a level playing field through smart energy policies, and strong international trade relations."
March 2019 highlights:
- Sustained record U.S. crude oil production (12.1 mb/d)
- Petroleum inventories increased by 6.4 percent y/y and were 4.7 percent above the 5-year average
- Gasoline demand (9.2 mb/d) in March decreased 2.1 percent year over year
- Strongest March distillate demand since 2007, but growth halved from 2018
- Strong March jet fuel demand, yet growth slowed
- Residual fuel demand decreased
- Refinery and petrochemical other oils' demand (5.2 mb/d) highest for March on record
- U.S. exports of crude oil and refined products fell by 4.0 percent between February and March
Notably, crude oil and refined products – since last year, the U.S. saw record exports for the month of March. However, total U.S. petroleum exports fell by 4.0 percent or 320 kb/d between February and March, slowing for the fourth consecutive month. U.S. petroleum imports fell to 9.1 mb/d, which for the month of March were the lowest imports since 1995. With exports falling relatively more than imports in March, the U.S. petroleum trade balance increased to 1.3 mb/d of net imports from 1.1 mb/d in February.
"The U.S. is playing a lead role in meeting rapidly increasing global energy demand, and its growing use of U.S. produced natural gas in electricity generation has resulted in significant savings for American households and has helped to reduce carbon dioxide emissions worldwide. Abundant, affordable natural gas and oil have helped U.S. households with their budgets – in fact, at a time when spending for healthcare, education and food rose significantly between 2007 and 2017, spending for household energy declined."
-----
Earlier:
2019, April, 17, 11:25:00
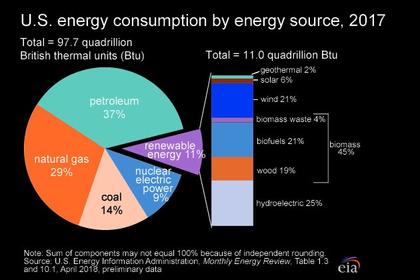
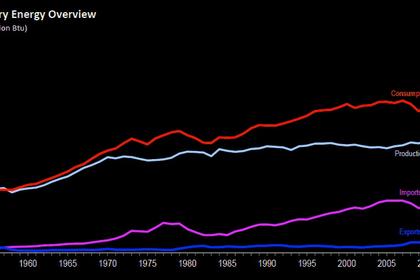
U.S. ENERGY CONSUMPTION UP 4%
U.S. EIA - Primary energy consumption in the United States reached a record high of 101.3 quadrillion British thermal units (Btu) in 2018, up 4% from 2017 and 0.3% above the previous record set in 2007. The increase in 2018 was the largest increase in energy consumption, in both absolute and percentage terms, since 2010.
2019, April, 17, 11:20:00
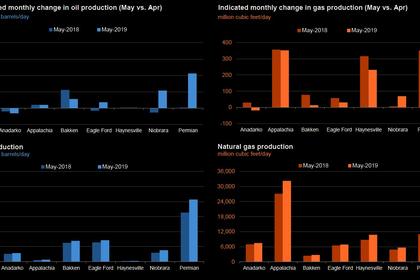
U.S. PRODUCTION: OIL + 85 TBD, GAS + 883 MCFD
U.S. EIA - Crude oil production from the major US onshore regions is forecast to increase 80,000 b/d month-over-month in April from 8,380 to 8,460 thousand barrels/day , gas production to increase 907 million cubic feet/day from 78,930 to 79,837 million cubic feet/day .
2019, April, 10, 11:10:00
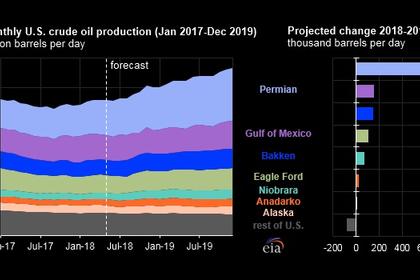
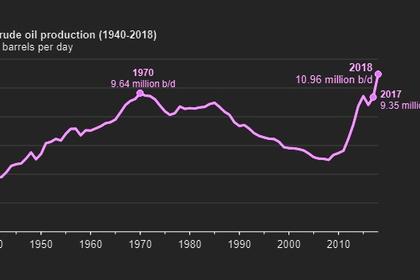
U.S. OIL PRODUCTION 10.96 MBD
Annual U.S. crude oil production reached a record level of 10.96 million barrels per day (b/d) in 2018, 1.6 million b/d (17%) higher than 2017 levels. In December 2018, monthly U.S. crude oil production reached 11.96 million b/d, the highest monthly level of crude oil production in U.S. history.
2019, April, 10, 10:40:00
U.S. SHALE OIL JOBS CUTS
Having slashed spending plans and run out of willing buyers for assets, some U.S. shale producers are turning to workforce cuts as investors step up demands for returns.
2019, April, 5, 10:40:00
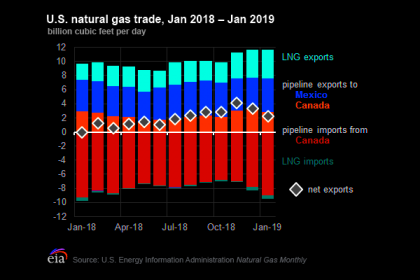
U.S. GAS EXPORTS UP
U.S. net natural gas exports in January 2019 totaled 2.3 billion cubic feet per day (Bcf/d), marking 12 consecutive months where U.S. natural gas exports exceeded U.S. imports.
2019, April, 1, 11:10:00
U.S. GAS PRODUCTION UP 13.7%
U.S. EIA - In January 2019, for the 21st consecutive month, dry natural gas production increased year to year for the month. The preliminary level for dry natural gas production in January 2019 was 2,746 billion cubic feet (Bcf), or 88.6 Bcf/d. This level was 10.7 Bcf/d (13.7%) higher than the January 2018 level of 77.9 Bcf/d.
2019, March, 27, 11:55:00
U.S. ENERGY CONSUMPTION UP
U.S. primary energy consumption totaled 101 quadrillion British thermal units (Btu). This total was the highest since at least 1949, the earliest year for which EIA has data.


