2019-04-17 11:20:00
U.S. PRODUCTION: OIL + 85 TBD, GAS + 883 MCFD
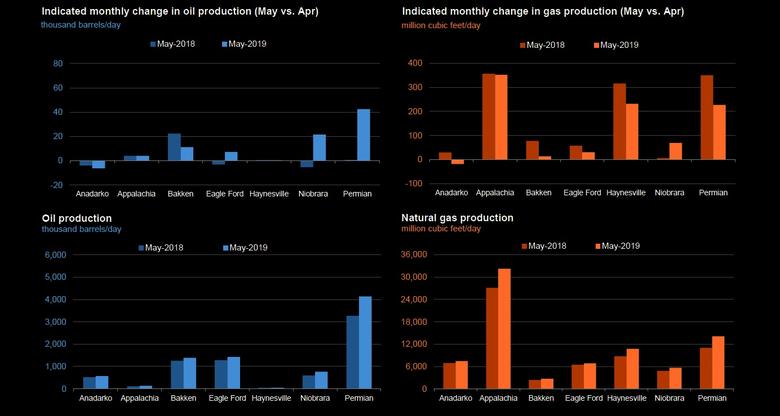
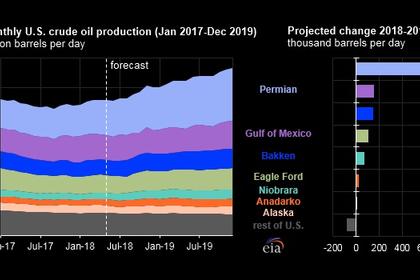
U.S. EIA - Crude oil production from the major US onshore regions is forecast to increase 80,000 b/d month-over-month in April from 8,380 to 8,460 thousand barrels/day , gas production to increase 907 million cubic feet/day from 78,930 to 79,837 million cubic feet/day .
| Oil production thousand barrels/day |
Gas production million cubic feet/day |
|||||
| Region | April 2019 | May 2019 | change | April 2019 | May 2019 | change |
| Anadarko | 573 | 567 | (6) | 7,507 | 7,489 | (18) |
| Appalachia | 131 | 135 | 4 | 31,862 | 32,215 | 353 |
| Bakken | 1,374 | 1,385 | 11 | 2,716 | 2,730 | 14 |
| Eagle Ford | 1,422 | 1,429 | 7 | 6,853 | 6,883 | 30 |
| Haynesville | 44 | 44 | - | 10,522 | 10,754 | 232 |
| Niobrara | 742 | 764 | 22 | 5,580 | 5,649 | 69 |
| Permian | 4,094 | 4,136 | 42 | 13,890 | 14,117 | 227 |
| Total | 8,380 | 8,460 | 80 | 78,930 | 79,837 | 907 |
| New-well oil production per rig barrels/day |
New-well gas production per rig thousand cubic feet/day |
|||||
| Region | April 2019 | May 2019 | change | April 2019 | May 2019 | change |
| Anadarko | 396 | 404 | 8 | 2,840 | 2,856 | 16 |
| Appalachia | 144 | 145 | 1 | 15,930 | 15,930 | - |
| Bakken | 1,401 | 1,407 | 6 | 1,953 | 1,953 | - |
| Eagle Ford | 1,341 | 1,344 | 3 | 4,892 | 4,902 | 10 |
| Haynesville | 26 | 26 | - | 9,825 | 9,942 | 117 |
| Niobrara | 1,267 | 1,278 | 11 | 4,164 | 4,171 | 7 |
| Permian | 618 | 650 | 32 | 1,248 | 1,286 | 38 |
| Rig-weighted average | 676 | 692 | 16 | 3,834 | 3,932 | 98 |
| Drilled but uncompleted wells (DUC) | |||
| wells | |||
| Region | February 2019 | March 2019 | change |
| Anadarko | 1,048 | 1,019 | -29 |
| Appalachia | 509 | 501 | -8 |
| Bakken | 722 | 710 | -12 |
| Eagle Ford | 1,514 | 1,509 | -5 |
| Haynesville | 211 | 212 | 1 |
| Niobrara | 528 | 528 | - |
| Permian | 3,972 | 4,021 | 49 |
| Total | 8,504 | 8,5 | -4 |
-----
Earlier:
2019, April, 10, 11:10:00
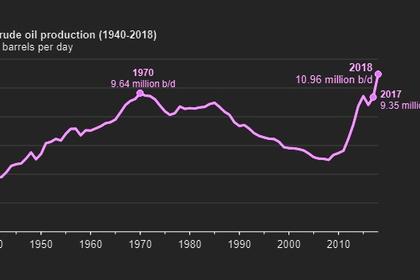
U.S. OIL PRODUCTION 10.96 MBD
Annual U.S. crude oil production reached a record level of 10.96 million barrels per day (b/d) in 2018, 1.6 million b/d (17%) higher than 2017 levels. In December 2018, monthly U.S. crude oil production reached 11.96 million b/d, the highest monthly level of crude oil production in U.S. history.
2019, April, 10, 10:40:00
U.S. SHALE OIL JOBS CUTS
Having slashed spending plans and run out of willing buyers for assets, some U.S. shale producers are turning to workforce cuts as investors step up demands for returns.
2019, April, 5, 10:40:00
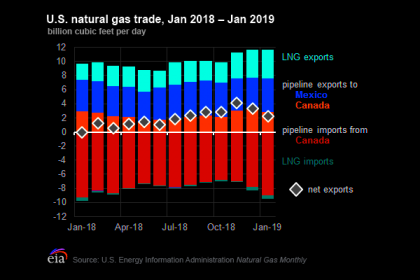
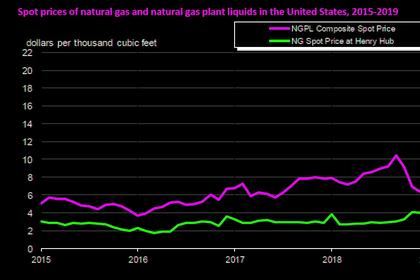
U.S. GAS EXPORTS UP
U.S. net natural gas exports in January 2019 totaled 2.3 billion cubic feet per day (Bcf/d), marking 12 consecutive months where U.S. natural gas exports exceeded U.S. imports.
2019, April, 1, 11:10:00
U.S. GAS PRODUCTION UP 13.7%
U.S. EIA - In January 2019, for the 21st consecutive month, dry natural gas production increased year to year for the month. The preliminary level for dry natural gas production in January 2019 was 2,746 billion cubic feet (Bcf), or 88.6 Bcf/d. This level was 10.7 Bcf/d (13.7%) higher than the January 2018 level of 77.9 Bcf/d.
2019, March, 27, 11:55:00
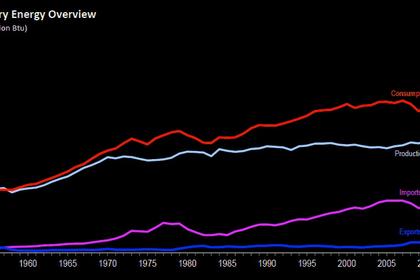
U.S. ENERGY CONSUMPTION UP
U.S. primary energy consumption totaled 101 quadrillion British thermal units (Btu). This total was the highest since at least 1949, the earliest year for which EIA has data.
2019, March, 22, 10:25:00
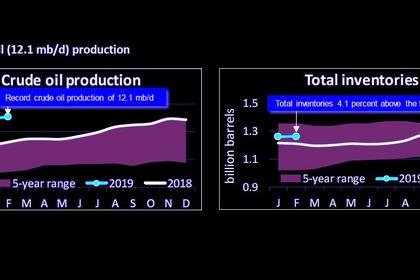
U.S. OIL PRODUCTION 12.1 MBD
U.S set a new record for oil production at 12.1 million barrels a day (mb/d) in February, continuing America’s position as the world’s leading oil producer.


