2019-04-19 09:05:00
U.S. TRADE DEFICIT $49.4 BLN
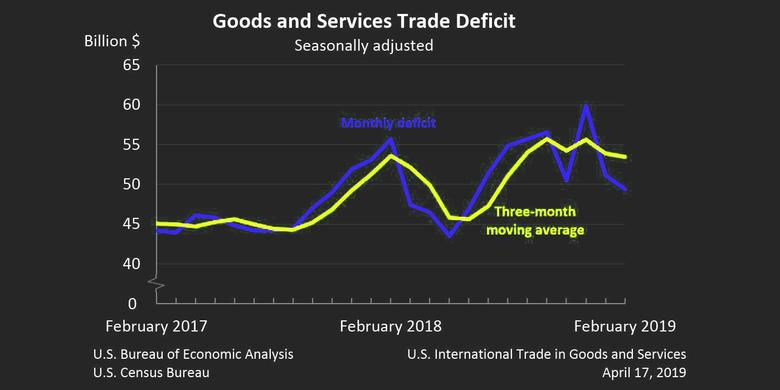
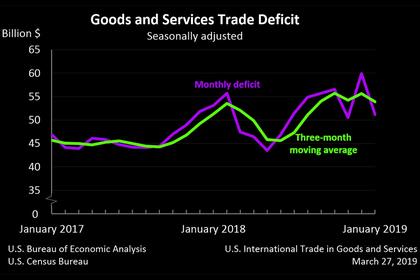
U.S. BEA - The U.S. Census Bureau and the U.S. Bureau of Economic Analysis announced today that the goods and services deficit was $49.4 billion in February, down $1.8 billion from $51.1 billion in January, revised.
| Deficit: | $49.4 Billion | -3.4%° |
| Exports: | $209.7 Billion | +1.1%° |
| Imports: | $259.1 Billion | +0.2%° |
|
Next release: May 9, 2019 (°) Statistical significance is not applicable or not measurable. Source: U.S. Census Bureau, U.S. Bureau of Economic Analysis; U.S. International Trade in Goods and Services, April 17, 2019 |
||
Exports, Imports, and Balance
February exports were $209.7 billion, $2.3 billion more than January exports. February imports were $259.1 billion, $0.6 billion more than January imports.
The February decrease in the goods and services deficit reflected a decrease in the goods deficit of $1.2 billion to $72.0 billion and an increase in the services surplus of $0.5 billion to $22.6 billion.
Year-to-date, the goods and services deficit decreased $8.3 billion, or 7.6 percent, from the same period in 2018. Exports increased $11.1 billion or 2.7 percent. Imports increased $2.8 billion or 0.5 percent.
Three-Month Moving Averages
The average goods and services deficit decreased $0.4 billion to $53.5 billion for the three months ending in February.
- Average exports increased $0.1 billion to $207.5 billion in February.
- Average imports decreased $0.3 billion to $261.0 billion in February.
Year-over-year, the average goods and services deficit decreased $0.1 billion from the three months ending in February 2018.
- Average exports increased $3.8 billion from February 2018.
- Average imports increased $3.7 billion from February 2018.
Exports
Exports of goods increased $2.1 billion to $139.5 billion in February.
Exports of goods on a Census basis increased $1.9 billion.
- Capital goods increased $2.1 billion.
- Civilian aircraft increased $2.2 billion.
- Automotive vehicles, parts, and engines increased $0.6 billion.
- Industrial supplies and materials decreased $0.4 billion.
Net balance of payments adjustments increased $0.2 billion.
Exports of services increased $0.2 billion to $70.1 billion in February.
- Transport increased $0.2 billion.
- Other business services, which includes research and development services; professional and management services; and technical, trade-related, and other services, increased $0.1 billion.
Imports
Imports of goods increased $0.9 billion to $211.6 billion in February.
Imports of goods on a Census basis increased $0.8 billion.
- Consumer goods increased $1.6 billion.
- Cell phones and other household goods increased $2.1 billion.
- Other goods increased $0.5 billion.
- Industrial supplies and materials decreased $1.2 billion.
Net balance of payments adjustments increased $0.1 billion.
Imports of services decreased $0.3 billion to $47.5 billion in February.
- Transport decreased $0.2 billion.
- Travel (for all purposes including education) decreased $0.1 billion.
- Government goods and services increased $0.1 billion.
Real Goods in 2012 Dollars – Census Basis
The real goods deficit decreased $1.8 billion to $81.8 billion in February.
- Real exports of goods increased $0.8 billion to $150.7 billion.
- Real imports of goods decreased $0.9 billion to $232.5 billion.
Revisions to January imports
- Imports of goods were revised down less than $0.1 billion.
- Imports of services were revised up less than $0.1 billion.
Goods by Selected Countries and Areas: Monthly – Census Basis
The February figures show surpluses, in billions of dollars, with South and Central America ($3.7), Hong Kong ($2.8), United Kingdom ($0.9), Brazil ($0.6), Singapore ($0.4), Canada ($0.4), and OPEC ($0.3). Deficits were recorded, in billions of dollars, with China ($30.1), European Union ($12.4), Mexico ($7.7), Japan ($6.7), Germany ($5.5), Italy ($2.8), South Korea ($2.4), India ($2.2), France ($2.2), Taiwan ($1.7), and Saudi Arabia ($0.3).
- The deficit with China decreased $3.1 billion to $30.1 billion in February. Exports increased $1.6 billion to $9.2 billion and imports decreased $1.5 billion to $39.3 billion.
- The surplus with Hong Kong increased $1.0 billion to $2.8 billion in February. Exports increased $0.9 billion to $3.2 billion and imports decreased $0.1 billion to $0.3 billion.
- The deficit with Japan increased $1.3 billion to $6.7 billion in February. Exports decreased $1.1 billion to $5.7 billion and imports increased $0.2 billion to $12.4 billion.
-----
Earlier:
2019, April, 17, 11:25:00
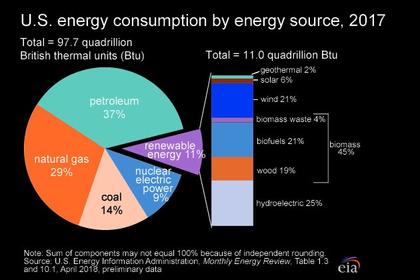
U.S. ENERGY CONSUMPTION UP 4%
U.S. EIA - Primary energy consumption in the United States reached a record high of 101.3 quadrillion British thermal units (Btu) in 2018, up 4% from 2017 and 0.3% above the previous record set in 2007. The increase in 2018 was the largest increase in energy consumption, in both absolute and percentage terms, since 2010.
2019, April, 17, 10:55:00
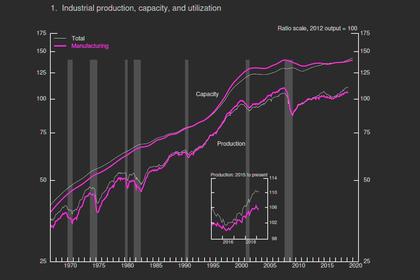
U.S. INDUSTRIAL PRODUCTION DOWN 0.1%
U.S. FRB - Industrial production edged down 0.1 percent in March after edging up 0.1 percent in February; for the first quarter as a whole, the index slipped 0.3 percent at an annual rate.
2019, April, 8, 11:05:00
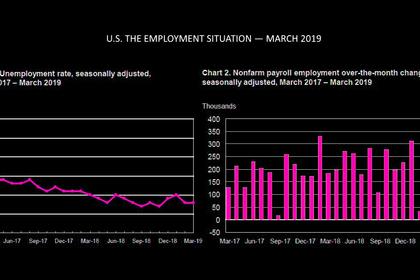
U.S. UNEMPLOYMENT 3.8%
U.S. Total nonfarm payroll employment increased by 196,000 in March, and the unemployment rate was unchanged at 3.8 percent, the U.S. Bureau of Labor
Statistics reported today. Notable job gains occurred in health care and in professional and technical services.
2019, March, 29, 11:20:00
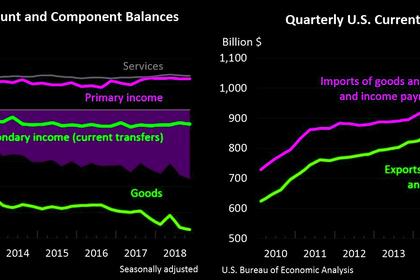
U.S. CURRENT ACCOUNT DEFICIT UP TO $134.4 billion
U.S. BEA - The U.S. current-account deficit increased to $134.4 billion (preliminary) in the fourth quarter of 2018 from $126.6 billion (revised) in the third quarter of 2018, according to statistics released by the Bureau of Economic Analysis (BEA). The deficit was 2.6 percent of current-dollar gross domestic product (GDP) in the fourth quarter, up from 2.5 percent in the third quarter.
2019, March, 29, 11:15:00
U.S. TRADE DEFICIT $51.1 BLN
U.S. BEA - The U.S. Census Bureau and the U.S. Bureau of Economic Analysis announced today that the goods and services deficit was $51.1 billion in January, down $8.8 billion from $59.9 billion in December,
2019, March, 29, 10:55:00
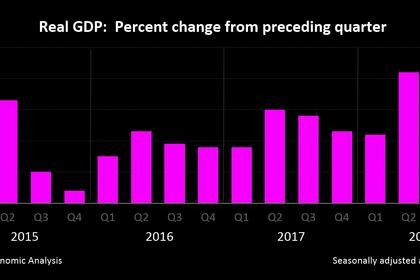
U.S. GDP UP 2.2%
U.S. BEA - Real gross domestic product (GDP) increased at an annual rate of 2.2 percent in the fourth quarter of 2018, according to the "third" estimate released by the Bureau of Economic Analysis. In the third quarter, real GDP increased 3.4 percent.


