2019-05-06 11:10:00
U.S. RIGS DOWN 1 TO 990
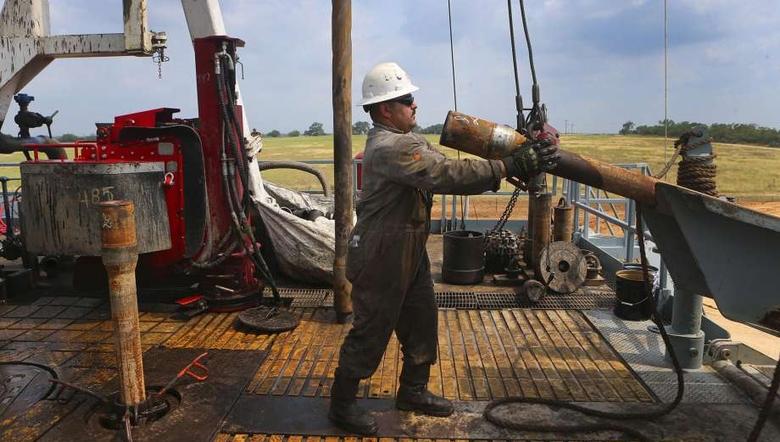
BHGE - U.S. Rig Count is down 1 rig from last week to 990, with oil rigs up 2 to 807, gas rigs down 3 to 183, and miscellaneous rigs unchanged at 0.
U.S. Rig Count is down 42 rigs from last year's count of 1,032, with oil rigs down 27, gas rigs down 13, and miscellaneous rigs down 2.
The U.S. Offshore Rig Count is down 1 rig to 20 and up 1 rig year-over-year.
Canada Rig Count is down 2 rigs from last week to 61, with oil rigs down 2 to 17 and gas rigs unchanged at 44.
Canada Rig Count is down 25 rigs from last year's count of 86, with oil rigs down 20 and gas rigs down 5.
| Rotary Rig Count | |||||||||
| 5/3/19 | |||||||||
| Week | Year | ||||||||
| Location | Week | +/- | Ago | +/- | Ago | ||||
| Land | 966 | 0 | 966 | -45 | 1011 | ||||
| Inland Waters | 4 | 0 | 4 | 2 | 2 | ||||
| Offshore | 20 | -1 | 21 | 1 | 19 | ||||
| United States Total | 990 | -1 | 991 | -42 | 1032 | ||||
| Gulf Of Mexico | 20 | -1 | 21 | 1 | 19 | ||||
| Canada | 61 | -2 | 63 | -25 | 86 | ||||
| North America | 1051 | -3 | 1054 | -67 | 1118 | ||||
| U.S. Breakout Information | This Week | +/- | Last Week | +/- | Year Ago | ||||
| Oil | 807 | 2 | 805 | -27 | 834 | ||||
| Gas | 183 | -3 | 186 | -13 | 196 | ||||
| Miscellaneous | 0 | 0 | 0 | -2 | 2 | ||||
| Directional | 71 | 0 | 71 | 7 | 64 | ||||
| Horizontal | 873 | 0 | 873 | -40 | 913 | ||||
| Vertical | 46 | -1 | 47 | -9 | 55 | ||||
| Canada Breakout Information | This Week | +/- | Last Week | +/- | Year Ago | ||||
| Oil | 17 | -2 | 19 | -20 | 37 | ||||
| Gas | 44 | 0 | 44 | -5 | 49 | ||||
| Major State Variances | This Week | +/- | Last Week | +/- | Year Ago | ||||
| Alaska | 9 | 3 | 6 | 3 | 6 | ||||
| Arkansas | 0 | 0 | 0 | -1 | 1 | ||||
| California | 12 | 0 | 12 | -3 | 15 | ||||
| Colorado | 33 | 1 | 32 | 6 | 27 | ||||
| Louisiana | 62 | 0 | 62 | 1 | 61 | ||||
| New Mexico | 106 | 2 | 104 | 13 | 93 | ||||
| North Dakota | 57 | -1 | 58 | 1 | 56 | ||||
| Ohio | 16 | 1 | 15 | -8 | 24 | ||||
| Oklahoma | 103 | 1 | 102 | -32 | 135 | ||||
| Pennsylvania | 42 | -1 | 43 | 3 | 39 | ||||
| Texas | 484 | -7 | 491 | -31 | 515 | ||||
| Utah | 7 | 0 | 7 | -1 | 8 | ||||
| West Virginia | 21 | 0 | 21 | 5 | 16 | ||||
| Wyoming | 32 | 0 | 32 | 5 | 27 | ||||
| Major Basin Variances | This Week | +/- | Last Week | +/- | Year Ago | ||||
| Ardmore Woodford | 5 | 0 | 5 | 3 | 2 | ||||
| Arkoma Woodford | 3 | 2 | 1 | -6 | 9 | ||||
| Barnett | 1 | 0 | 1 | -2 | 3 | ||||
| Cana Woodford | 46 | 0 | 46 | -23 | 69 | ||||
| DJ-Niobrara | 30 | 1 | 29 | 8 | 22 | ||||
| Eagle Ford | 74 | 1 | 73 | -2 | 76 | ||||
| Granite Wash | 8 | 0 | 8 | -3 | 11 | ||||
| Haynesville | 52 | -2 | 54 | -2 | 54 | ||||
| Marcellus | 61 | -1 | 62 | 7 | 54 | ||||
| Mississippian | 6 | 1 | 5 | 2 | 4 | ||||
| Permian | 459 | -1 | 460 | 1 | 458 | ||||
| Utica | 18 | 1 | 17 | -7 | 25 | ||||
| Williston | 57 | -1 | 58 | 0 | 57 | ||||
-----
Earlier:
2019, April, 29, 10:50:00
U.S. RIGS DOWN 21 TO 991
BHGE - U.S. Rig Count is down 21 rigs from last week to 991, with oil rigs down 20 to 805, gas rigs down 1 to 186, and miscellaneous rigs unchanged at 0. Canada Rig Count is down 3 rigs from last week to 63, with oil rigs unchanged at 19 and gas rigs down 3 to 44.
2019, April, 19, 09:40:00
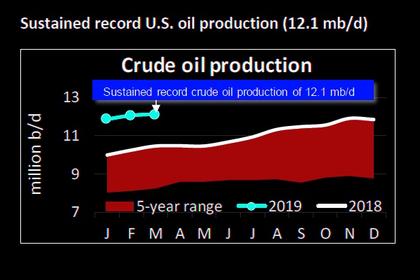
U.S. OIL PRODUCTION 12.1 MBD
the U.S. sustained its position as the world’s leading oil producer, continuing a pace of 12.1 million barrels a day (mb/d), matching February 2019. In addition, petroleum demand in March was the strongest for that month in more than a decade at 20.7 mb/d.

2019, April, 19, 09:00:00
U.S. RIGS DOWN 10 TO 1,012
BHGE - U.S. Rig Count is down 10 rigs from last week to 1,012, with oil rigs down 8 to 825, gas rigs down 2 to 187, and miscellaneous rigs unchanged at 0. Canada Rig Count unchanged from last week at 66, with oil rigs up 1 to 19 and gas rigs down 1 to 47.
2019, April, 17, 11:25:00
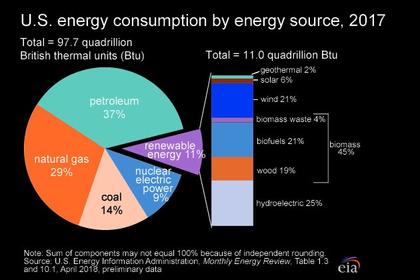
U.S. ENERGY CONSUMPTION UP 4%
U.S. EIA - Primary energy consumption in the United States reached a record high of 101.3 quadrillion British thermal units (Btu) in 2018, up 4% from 2017 and 0.3% above the previous record set in 2007. The increase in 2018 was the largest increase in energy consumption, in both absolute and percentage terms, since 2010.
2019, April, 17, 11:20:00
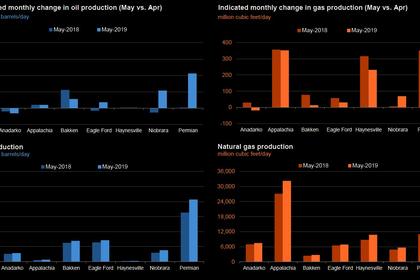
U.S. PRODUCTION: OIL + 80 TBD, GAS + 907 MCFD
U.S. EIA - Crude oil production from the major US onshore regions is forecast to increase 80,000 b/d month-over-month in April from 8,380 to 8,460 thousand barrels/day , gas production to increase 907 million cubic feet/day from 78,930 to 79,837 million cubic feet/day .
2019, April, 15, 11:30:00
U.S. RIGS DOWN 3 TO 1,022
BHGE - U.S. Rig Count is down 3 rigs from last week to 1,022, with oil rigs up 2 to 833, gas rigs down 5 to 189, and miscellaneous rigs unchanged at 0. Canada Rig Count is down 2 rigs from last week to 66, with oil rigs down 4 to 18 and gas rigs up 2 to 48.


