2019-05-08 11:25:00


RENEWABLE CAPACITY STOP
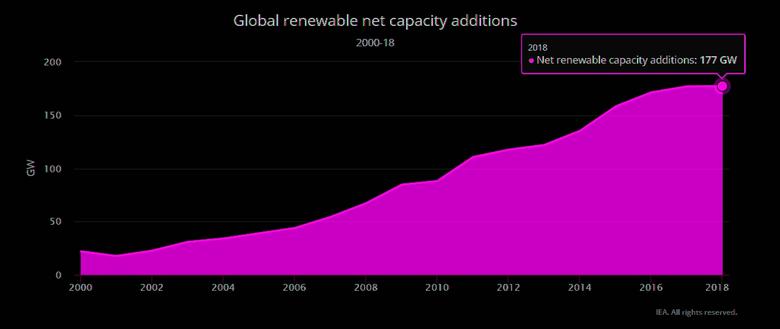
IEA - After nearly two decades of strong annual growth, renewables around the world added as much net capacity in 2018 as they did in 2017, an unexpected flattening of growth trends that raises concerns about meeting long-term climate goals.
Last year was the first time since 2001 that growth in renewable power capacity failed to increase year on year. New net capacity from solar PV, wind, hydro, bioenergy, and other renewable power sources increased by about 180 Gigawatts (GW) in 2018, the same as the previous year, according to the International Energy Agency's latest data. That's only around 60% of the net additions needed each year to meet long-term climate goals.

Renewables have a major role to play in curbing global emissions. Renewable capacity additions need to grow by over 300 GW on average each year between 2018 and 2030 to reach the goals of the Paris Agreement, according to the IEA's Sustainable Development Scenario (SDS).
But the IEA's analysis shows the world is not doing enough. Last year, energy-related CO2 emissions rose by 1.7% to a historic high of 33 Gigatonnes. Despite a growth of 7% in renewables electricity generation, emissions from the power sector grew to record levels.
"The world cannot afford to press "pause" on the expansion of renewables and governments need to act quickly to correct this situation and enable a faster flow of new projects," said Dr Fatih Birol, the IEA's Executive Director. "Thanks to rapidly declining costs, the competitiveness of renewables is no longer heavily tied to financial incentives. What they mainly need are stable policies supported by a long-term vision but also a focus on integrating renewables into power systems in a cost-effective and optimal way. Stop-and-go policies are particularly harmful to markets and jobs."
Since 2015, global solar PV's exponential growth had been compensating for slower increases in wind and hydropower. But solar PV's growth flattened in 2018, adding 97 GW of capacity and falling short of expectations it would surpass the symbolic 100 GW mark. The main reason was a sudden change in China's solar PV incentives to curb costs and address grid integration challenges to achieve more sustainable PV expansion. Moreover, lower wind additions in the European Union and India also contributed to stalling renewable capacity growth in 2018.
China added 44 GW of solar PV in 2018, compared with 53 GW in 2017. Growth was stable in the United States, but solar PV additions increased in the European Union, Mexico, the Middle East and Africa, which together compensated for the slowdown in China.

Despite slower solar PV growth, China accounted for almost 45% of the total capacity increase in renewable electricity last year. With new transmission lines and higher electricity demand, China's wind additions picked up last year, but hydropower expansion continued to slow, maintaining a trend observed since 2013.
Capacity additions in the European Union, the second-largest market for renewables, saw a slight decline. Solar PV grew compared with the previous year, while wind additions slowed down. Policy transition challenges and changing renewable incentives resulted in slower growth of onshore wind in India and of solar PV in Japan.
In the United States, the third-largest market, renewable capacity additions increased slightly in 2018, mainly driven by faster onshore wind expansion while solar PV growth was flat.
Renewable capacity expansion accelerated in many emerging economies and developing countries in the Middle East, North Africa and parts of Asia, led by wind and solar PV as a result of rapid cost declines.
Governments can accelerate the growth in renewables by addressing policy uncertainties and ensuring cost-effective system integration of wind and solar. Reducing risks affecting clean energy investment in developing countries, especially in Africa, will also be critical.
"These 2018 data are deeply worrying, but smart and determined policies can get renewable capacity additions back on an upward trend. We are helping all 38 members of the IEA Family, and all other countries around the world, in their energy transitions with targeted policy advice aimed at accelerating investment in a global portfolio of renewable energy technologies, as well as energy efficiency, carbon capture, utilisation and storage, and all other clean-energy technologies," said Dr Birol.
Data tables
Net capacity additions by technology (GW)
| 2001 | 2002 | 2003 | 2004 | 2005 | 2006 | 2007 | 2008 | 2009 | 2010 | 2011 | 2012 | 2013 | 2014 | 2015 | 2016 | 2017 | 2018 | |
| Hydropower | 8 | 14 | 19 | 22 | 21 | 25 | 31 | 32 | 34 | 33 | 33 | 34 | 44 | 38 | 34 | 36 | 25 | 20 |
| Bioenergy | 2 | 2 | 3 | 2 | 5 | 3 | 2 | 4 | 8 | 7 | 8 | 6 | 7 | 6 | 7 | 9 | 7 | 9 |
| Wind | 7 | 7 | 8 | 9 | 11 | 15 | 18 | 24 | 35 | 31 | 39 | 47 | 33 | 49 | 68 | 51 | 48 | 50 |
| Solar PV | 0 | 0 | 1 | 1 | 1 | 2 | 2 | 6 | 8 | 17 | 31 | 30 | 37 | 40 | 49 | 75 | 97 | 97 |
| Other renewables | 0 | 0 | 0 | 0 | 0 | 0 | 0 | 0 | 1 | 1 | 1 | 1 | 2 | 1 | 1 | 1 | 1 | 1 |
| Total | 18 | 23 | 31 | 34 | 39 | 44 | 54 | 67 | 85 | 88 | 111 | 118 | 122 | 135 | 158 | 171 | 177 | 177 |
Net capacity additions by country and region (GW)
| 2001 | 2002 | 2003 | 2004 | 2005 | 2006 | 2007 | 2008 | 2009 | 2010 | 2011 | 2012 | 2013 | 2014 | 2015 | 2016 | 2017 | 2018 | |
| China | 3 | 4 | 9 | 11 | 13 | 14 | 21 | 29 | 34 | 33 | 37 | 36 | 58 | 56 | 65 | 66 | 82 | 77 |
| United States | 1 | 2 | 1 | 0 | 3 | 4 | 7 | 9 | 11 | 7 | 8 | 18 | 8 | 12 | 17 | 24 | 17 | 18 |
| European Union | 6 | 7 | 8 | 10 | 12 | 11 | 11 | 16 | 23 | 26 | 38 | 34 | 23 | 19 | 25 | 22 | 23 | 22 |
| India | 1 | 1 | 2 | 4 | 3 | 4 | 4 | 5 | 2 | 4 | 6 | 2 | 2 | 8 | 7 | 12 | 15 | 14 |
| Japan | 0 | 0 | 1 | 1 | 1 | 1 | 0 | 1 | 1 | 2 | 2 | 2 | 7 | 11 | 12 | 9 | 8 | 7 |
| Other countries | 5 | 9 | 10 | 9 | 7 | 10 | 12 | 9 | 13 | 16 | 19 | 25 | 23 | 30 | 33 | 39 | 32 | 40 |
| World | 18 | 23 | 31 | 34 | 39 | 44 | 54 | 67 | 85 | 88 | 111 | 118 | 122 | 135 | 158 | 171 | 177 | 177 |
Notes: The members of the IEA family are Australia, Austria, Belgium, Brazil, Canada, China, Czech Republic, Denmark, Estonia, Finland, France, Germany, Greece, Hungary, India, Indonesia, Ireland, Italy, Japan, Korea, Luxembourg, Mexico, Morocco, New Zealand, Norway, Poland, Portugal, Slovak Republic, Spain, Sweden, Switzerland, The Netherlands, Singapore, South Africa, Thailand, Turkey, the United Kingdom, the United States.
Correction 7 May 2019: an earlier version of this article omitted "additions" from the final paragraph.
-----
Earlier:
2019, April, 29, 11:20:00
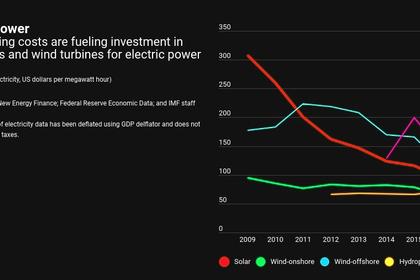
RENEWABLE FALLING COSTS
Now, rapidly falling costs for these technologies are boosting global renewable energy capacity. Renewable energy sources can help reduce carbon emissions substantially and the effects of global warming.
2019, April, 22, 08:10:00
BRITAIN'S RENEWABLE 33%
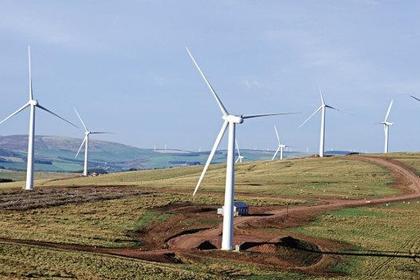
Renewable energy sources generated approximately 33 per cent of Great Britain’s electricity over the first quarter of 2019, according to new figures published by energy consultancy EnAppSys, with wind energy accounting for over 60% of renewable generation.
2019, April, 15, 11:35:00
AUSTRIA'S RENEWABLE INVESTMENT EUR2.5 BLN
Austrian power grid operator APG plans to invest Eur2.5 billion over the next 10 years to future-proof its network against a massive expansion of wind and solar, it said.


