2019-05-17 07:05:00


U.S. INDUSTRIAL PRODUCTION DOWN 1.9%
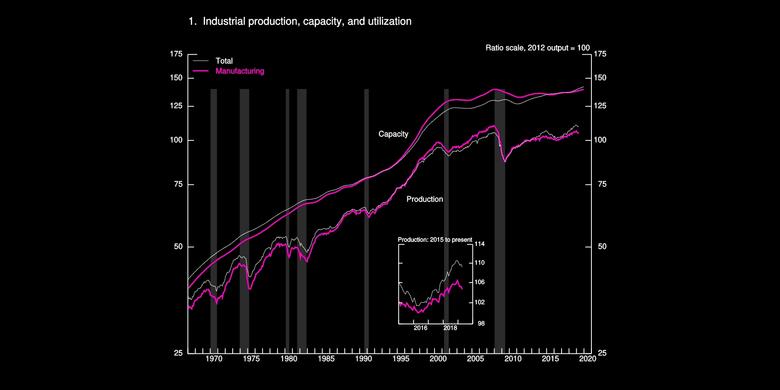
U.S. FRB - Industrial production fell 0.5 percent in April, and the rates of change for previous months were revised down on net. Output is now reported to have declined 1.9 percent at an annual rate in the first quarter. Manufacturing production moved down 0.5 percent in April after being unchanged in March. The index for mining advanced 1.6 percent in April, while the index for utilities fell 3.5 percent. At 109.2 percent of its 2012 average, total industrial production was 0.9 percent higher in April than it was a year earlier. Capacity utilization for the industrial sector decreased 0.6 percentage point in April to 77.9 percent, a rate that is 1.9 percentage points below its long-run (1972–2018) average.


Market Groups
Most major market groups posted decreases in April. The production of consumer goods fell 1.2 percent, with declines for both durables and nondurables. The index for durable consumer goods moved down 0.8 percent, mostly because of a drop in the output of automotive products, while the output of nondurables was held down by sizable declines for both chemical products and consumer energy products. Production decreased for business equipment, construction supplies, and business supplies, but output advanced for defense and space equipment and for materials. Among the components of materials, a drop for durables was more than offset by gains for nondurable and energy materials.
Industry Groups
Manufacturing output declined 0.5 percent in April after having decreased about 0.4 percent per month, on average, during the previous three months. In April, the production of durable goods fell almost 1 percent, but the index for nondurable goods only edged down. Among durables, losses of 2 percent or more were posted by machinery; electrical equipment, appliances, and components; and motor vehicles and parts. Among nondurables, the results were mixed—the largest gains were recorded by apparel and by paper and products, and the largest declines were recorded by textile and product mills and by plastics and rubber products. The index for other manufacturing (publishing and logging) declined 0.3 percent and was well below its year-earlier level.
The output of utilities fell 3.5 percent in April, with declines in the indexes for both natural gas and electric utilities; demand for heating decreased last month because of temperatures that were warmer than normal. After having fallen for three consecutive months, mining output stepped up 1.6 percent in April and was 10.4 percent above its level of a year earlier. The increase in the mining index for April reflected gains in the oil and gas sector as well as a jump in coal mining that followed a few months of declines.
Capacity utilization for manufacturing dropped 0.5 percentage point in April to 75.7 percent, a rate that is 2.6 percentage points below its long-run average. The utilization rate for durable manufacturing declined, while the rates for nondurable manufacturing and for other manufacturing (publishing and logging) were little changed. Capacity utilization for mining increased to 91.4 percent and remained well above its long-run average of 87.1 percent. The utilization rate for utilities dropped to 76.2 percent and was more than 9 percentage points below its long-run average.
-----
Earlier:
2019, May, 15, 11:52:00
U.S. ENERGY PRODUCTION UP 8%
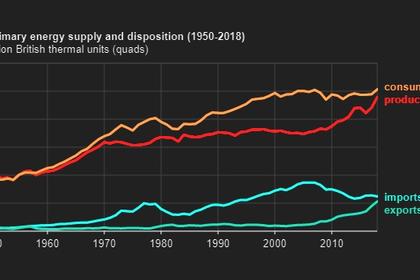
The United States produced a record amount of energy from various sources in 2018, reaching 96 quadrillion British thermal units (quads), an 8% increase from 2017. This increase in production outpaced the 4% increase in U.S. energy consumption, which also reached a record high of 101 quads.
2019, May, 15, 11:35:00
U.S. PRODUCTION: OIL + 83 TBD, GAS + 943 MCFD
U.S. EIA - Crude oil production from the major US onshore regions is forecast to increase 83,000 b/d month-over-month in June from 8,412 to 8,495 thousand barrels/day, gas production to increase 943 million cubic feet/day from 79,720 to 80,663 million cubic feet/day .
2019, May, 13, 12:35:00
U.S. OIL PROFITABILITY $28 BLN
Net income for 43 U.S. oil producers totaled $28 billion in 2018, a five-year high. Based on net income, 2018 was the most profitable year for these U.S. oil producers since 2013, despite crude oil prices that were lower in 2018 than in 2013 on an annual average basis.
2019, May, 13, 12:15:00
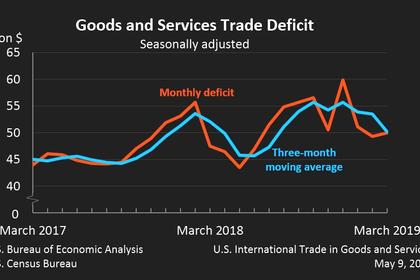
U.S. TRADE DEFICIT UPDOWN
Year-to-date, the goods and services deficit decreased $5.8 billion, or 3.7 percent, from the same period in 2018. Exports increased $14.0 billion or 2.3 percent. Imports increased $8.2 billion or 1.1 percent.
2019, May, 8, 11:00:00
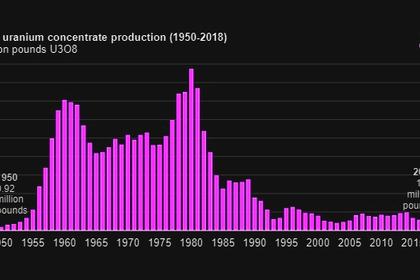
U.S. URANIUM DOWN AGAIN
The United States produced 1.47 million pounds of uranium concentrate in 2018, down for the fourth consecutive year and the lowest total since 1950,
2019, May, 6, 11:35:00
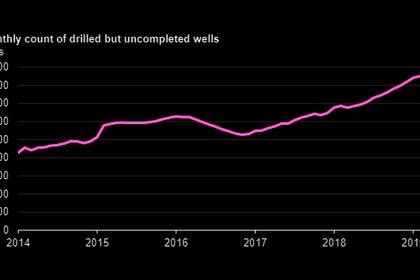
U.S. UNCOMPLETED WELLS UP
The number of drilled but uncompleted wells in seven key oil and natural gas production regions in the United States has increased over the last two years, reaching a high of 8,504 wells in February 2019,
2019, May, 6, 11:35:00
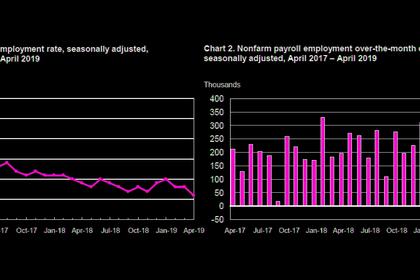
U.S. UNEMPLOYMENT DOWN TO 3.6%
Total nonfarm payroll employment increased by 263,000 in April, and the unemployment rate declined to 3.6 percent, the U.S. Bureau of Labor Statistics reported


