2019-05-20 11:05:00
U.S. RIGS DOWN 1 TO 987
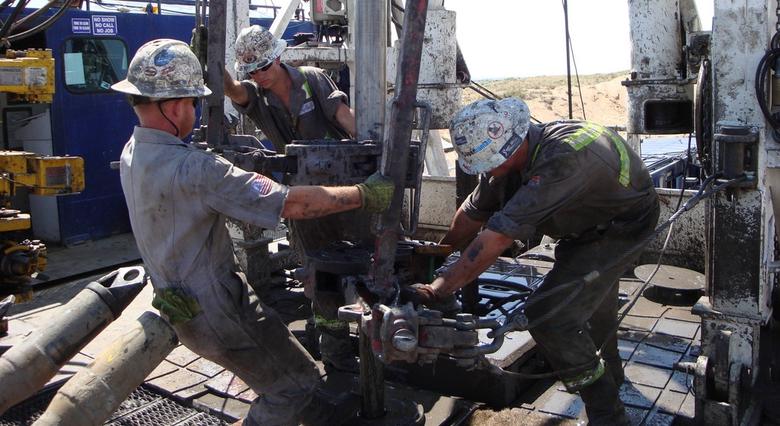
BHGE - U.S. Rig Count is down 1 rig from last week to 987, with oil rigs down 3 to 802, gas rigs up 2 to 185, and miscellaneous rigs unchanged at 0.
U.S. Rig Count is down 59 rigs from last year's count of 1,046, with oil rigs down 42, gas rigs down 15, and miscellaneous rigs down 2.
The U.S. Offshore Rig Count is up 2 rigs to 22 and up 3 rigs year-over-year.
Canada Rig Count is unchanged from last week at 63, with oil rigs unchanged at 22 and gas rigs unchanged at 41.
Canada Rig Count is down 20 rigs from last year's count of 83, with oil rigs down 16 and gas rigs down 4.
| Rotary Rig Count | |||||||||
| 5/17/19 | |||||||||
| Week | Year | ||||||||
| Location | Week | +/- | Ago | +/- | Ago | ||||
| Land | 961 | -3 | 964 | -62 | 1023 | ||||
| Inland Waters | 4 | 0 | 4 | 0 | 4 | ||||
| Offshore | 22 | 2 | 20 | 3 | 19 | ||||
| United States Total | 987 | -1 | 988 | -59 | 1046 | ||||
| Gulf Of Mexico | 22 | 2 | 20 | 4 | 18 | ||||
| Canada | 63 | 0 | 63 | -20 | 83 | ||||
| North America | 1050 | -1 | 1051 | -79 | 1129 | ||||
| U.S. Breakout Information | This Week | +/- | Last Week | +/- | Year Ago | ||||
| Oil | 802 | -3 | 805 | -42 | 844 | ||||
| Gas | 185 | 2 | 183 | -15 | 200 | ||||
| Miscellaneous | 0 | 0 | 0 | -2 | 2 | ||||
| Directional | 73 | 2 | 71 | 7 | 66 | ||||
| Horizontal | 866 | -6 | 872 | -53 | 919 | ||||
| Vertical | 48 | 3 | 45 | -13 | 61 | ||||
| Canada Breakout Information | This Week | +/- | Last Week | +/- | Year Ago | ||||
| Oil | 22 | 0 | 22 | -16 | 38 | ||||
| Gas | 41 | 0 | 41 | -4 | 45 | ||||
| Major State Variances | This Week | +/- | Last Week | +/- | Year Ago | ||||
| Alaska | 7 | -2 | 9 | 0 | 7 | ||||
| Arkansas | 0 | 0 | 0 | -1 | 1 | ||||
| California | 15 | 0 | 15 | 0 | 15 | ||||
| Colorado | 33 | 0 | 33 | 4 | 29 | ||||
| Kansas | 0 | 0 | 0 | -1 | 1 | ||||
| Louisiana | 63 | 2 | 61 | 2 | 61 | ||||
| New Mexico | 103 | 1 | 102 | 11 | 92 | ||||
| North Dakota | 56 | 0 | 56 | 1 | 55 | ||||
| Ohio | 20 | 4 | 16 | -3 | 23 | ||||
| Oklahoma | 103 | -2 | 105 | -35 | 138 | ||||
| Pennsylvania | 40 | -3 | 43 | 1 | 39 | ||||
| Texas | 482 | -3 | 485 | -43 | 525 | ||||
| Utah | 7 | 0 | 7 | -1 | 8 | ||||
| West Virginia | 20 | -1 | 21 | 3 | 17 | ||||
| Wyoming | 33 | 3 | 30 | 7 | 26 | ||||
| Major Basin Variances | This Week | +/- | Last Week | +/- | Year Ago | ||||
| Ardmore Woodford | 5 | 0 | 5 | 3 | 2 | ||||
| Arkoma Woodford | 3 | 0 | 3 | -6 | 9 | ||||
| Barnett | 1 | 0 | 1 | -2 | 3 | ||||
| Cana Woodford | 48 | 1 | 47 | -24 | 72 | ||||
| DJ-Niobrara | 30 | 1 | 29 | 6 | 24 | ||||
| Eagle Ford | 74 | 0 | 74 | -3 | 77 | ||||
| Granite Wash | 7 | -1 | 8 | -7 | 14 | ||||
| Haynesville | 50 | -2 | 52 | -4 | 54 | ||||
| Marcellus | 60 | -3 | 63 | 5 | 55 | ||||
| Mississippian | 6 | 0 | 6 | 2 | 4 | ||||
| Permian | 454 | -3 | 457 | -13 | 467 | ||||
| Utica | 20 | 3 | 17 | -4 | 24 | ||||
| Williston | 56 | 0 | 56 | 0 | 56 | ||||
-----
Earlier:
2019, May, 15, 11:52:00
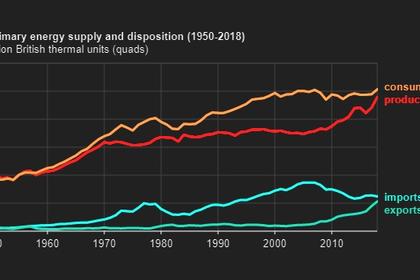
U.S. ENERGY PRODUCTION UP 8%
The United States produced a record amount of energy from various sources in 2018, reaching 96 quadrillion British thermal units (quads), an 8% increase from 2017. This increase in production outpaced the 4% increase in U.S. energy consumption, which also reached a record high of 101 quads.
2019, May, 15, 11:35:00
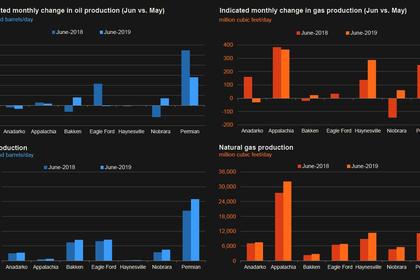
U.S. PRODUCTION: OIL + 83 TBD, GAS + 943 MCFD
U.S. EIA - Crude oil production from the major US onshore regions is forecast to increase 83,000 b/d month-over-month in June from 8,412 to 8,495 thousand barrels/day, gas production to increase 943 million cubic feet/day from 79,720 to 80,663 million cubic feet/day .
2019, May, 13, 12:35:00
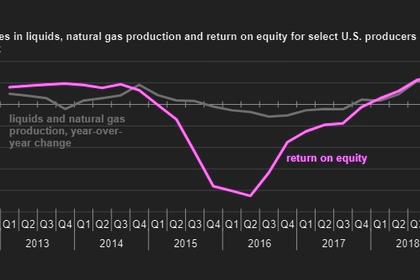
U.S. OIL PROFITABILITY $28 BLN
Net income for 43 U.S. oil producers totaled $28 billion in 2018, a five-year high. Based on net income, 2018 was the most profitable year for these U.S. oil producers since 2013, despite crude oil prices that were lower in 2018 than in 2013 on an annual average basis.

2019, May, 13, 11:40:00
U.S. RIGS DOWN 2 TO 988
BHGE - U.S. Rig Count is down 2 rigs from last week to 988, with oil rigs down 2 to 805, gas rigs unchanged at 183, and miscellaneous rigs unchanged at 0. Canada Rig Count is up 2 rigs from last week to 63, with oil rigs up 5 to 22 and gas rigs down 3 to 41.
2019, May, 6, 11:35:00
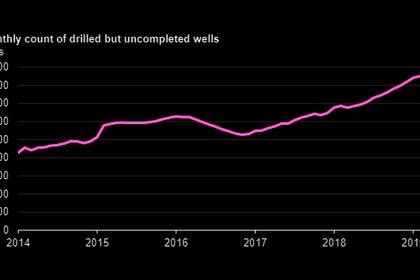
U.S. UNCOMPLETED WELLS UP
The number of drilled but uncompleted wells in seven key oil and natural gas production regions in the United States has increased over the last two years, reaching a high of 8,504 wells in February 2019,


