2019-05-27 11:25:00
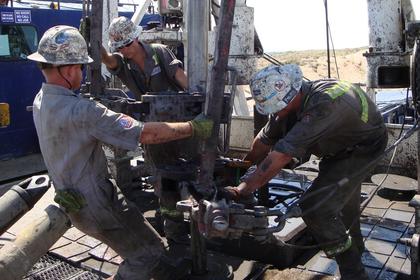
U.S. RIGS DOWN 4 TO 983
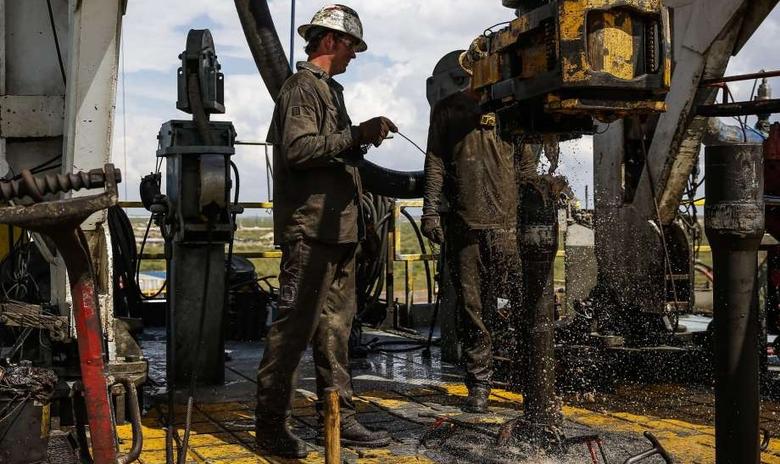
BHGE - U.S. Rig Count is down 4 rigs from last week to 983, with oil rigs down 5 to 797, gas rigs up 1 to 186, and miscellaneous rigs unchanged at 0.
U.S. Rig Count is down 76 rigs from last year's count of 1,059, with oil rigs down 62, gas rigs down 12, and miscellaneous rigs down 2.
The U.S. Offshore Rig Count is unchanged at 22 and up 3 rigs year-over-year.
Canada Rig Count is up 15 rigs from last week to 78, with oil rigs up 16 to 38 and gas rigs down 1 to 40.
Canada Rig Count is down 3 rigs from last year's count of 81, with oil rigs up 3 and gas rigs down 6.
| Rotary Rig Count | |||||||||
| 5/24/19 | |||||||||
| Week | Year | ||||||||
| Location | Week | +/- | Ago | +/- | Ago | ||||
| Land | 957 | -4 | 961 | -79 | 1036 | ||||
| Inland Waters | 4 | 0 | 4 | 0 | 4 | ||||
| Offshore | 22 | 0 | 22 | 3 | 19 | ||||
| United States Total | 983 | -4 | 987 | -76 | 1059 | ||||
| Gulf Of Mexico | 22 | 0 | 22 | 4 | 18 | ||||
| Canada | 78 | 15 | 63 | -3 | 81 | ||||
| North America | 1061 | 11 | 1050 | -79 | 1140 | ||||
| U.S. Breakout Information | This Week | +/- | Last Week | +/- | Year Ago | ||||
| Oil | 797 | -5 | 802 | -62 | 859 | ||||
| Gas | 186 | 1 | 185 | -12 | 198 | ||||
| Miscellaneous | 0 | 0 | 0 | -2 | 2 | ||||
| Directional | 69 | -4 | 73 | 2 | 67 | ||||
| Horizontal | 863 | -3 | 866 | -63 | 926 | ||||
| Vertical | 51 | 3 | 48 | -15 | 66 | ||||
| Canada Breakout Information | This Week | +/- | Last Week | +/- | Year Ago | ||||
| Oil | 38 | 16 | 22 | 3 | 35 | ||||
| Gas | 40 | -1 | 41 | -6 | 46 | ||||
| Major State Variances | This Week | +/- | Last Week | +/- | Year Ago | ||||
| Alaska | 7 | 0 | 7 | -2 | 9 | ||||
| Arkansas | 0 | 0 | 0 | -1 | 1 | ||||
| California | 18 | 3 | 15 | 3 | 15 | ||||
| Colorado | 31 | -2 | 33 | 0 | 31 | ||||
| Louisiana | 63 | 0 | 63 | 3 | 60 | ||||
| New Mexico | 99 | -4 | 103 | 8 | 91 | ||||
| North Dakota | 57 | 1 | 56 | 1 | 56 | ||||
| Ohio | 19 | -1 | 20 | -4 | 23 | ||||
| Oklahoma | 103 | 0 | 103 | -37 | 140 | ||||
| Pennsylvania | 41 | 1 | 40 | 2 | 39 | ||||
| Texas | 481 | -1 | 482 | -53 | 534 | ||||
| Utah | 6 | -1 | 7 | -2 | 8 | ||||
| West Virginia | 21 | 1 | 20 | 3 | 18 | ||||
| Wyoming | 32 | -1 | 33 | 6 | 26 | ||||
| Major Basin Variances | This Week | +/- | Last Week | +/- | Year Ago | ||||
| Ardmore Woodford | 5 | 0 | 5 | 2 | 3 | ||||
| Arkoma Woodford | 3 | 0 | 3 | -6 | 9 | ||||
| Barnett | 1 | 0 | 1 | -3 | 4 | ||||
| Cana Woodford | 45 | -3 | 48 | -28 | 73 | ||||
| DJ-Niobrara | 29 | -1 | 30 | 4 | 25 | ||||
| Eagle Ford | 75 | 1 | 74 | -3 | 78 | ||||
| Granite Wash | 7 | 0 | 7 | -7 | 14 | ||||
| Haynesville | 50 | 0 | 50 | -4 | 54 | ||||
| Marcellus | 62 | 2 | 60 | 6 | 56 | ||||
| Mississippian | 4 | -2 | 6 | -1 | 5 | ||||
| Permian | 451 | -3 | 454 | -27 | 478 | ||||
| Utica | 19 | -1 | 20 | -5 | 24 | ||||
| Williston | 57 | 1 | 56 | 0 | 57 | ||||
-----
Earlier:
2019, May, 23, 12:15:00
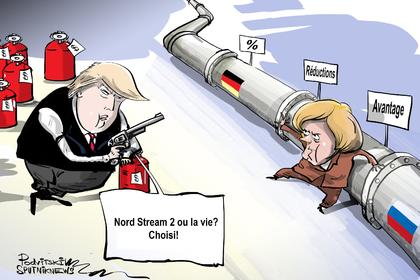
U.S. SANCTIONS FOR GERMANY
The German Economy Ministry has taken note of the threat of U.S. sanctions being placed on the Nord Stream 2 gas pipeline project, a spokeswoman said on Wednesday, adding that Berlin rejected sanctions that have extraterritorial effect.
2019, May, 20, 11:10:00
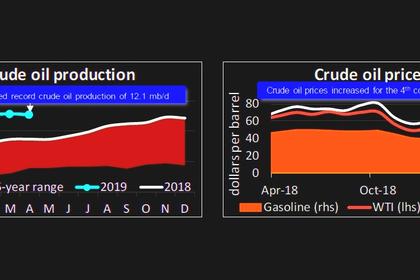
U.S. OIL PRODUCTION 12.1 MBD
U.S. crude oil production sustained a record-tying 12.1 million barrels per day (mb/d) in April while total petroleum demand was the highest for the month since 2007 at 20.2 million barrels per day.
2019, May, 20, 11:05:00
U.S. RIGS DOWN 1 TO 987
BHGE - U.S. Rig Count is down 1 rig from last week to 987, with oil rigs down 3 to 802, gas rigs up 2 to 185, and miscellaneous rigs unchanged at 0. Canada Rig Count is unchanged from last week at 63, with oil rigs unchanged at 22 and gas rigs unchanged at 41.


