2019-05-13 12:15:00
U.S. TRADE DEFICIT UPDOWN
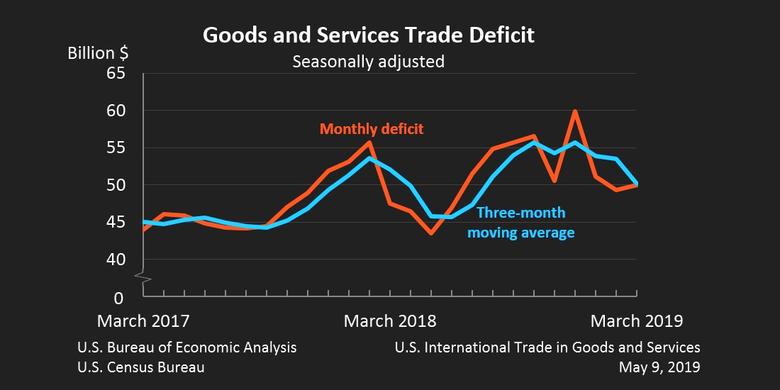
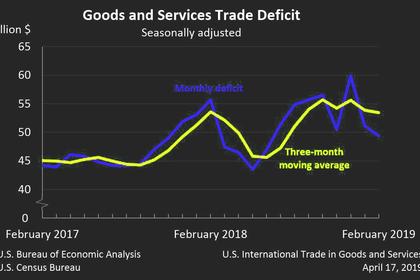
U.S. BEA - The U.S. Census Bureau and the U.S. Bureau of Economic Analysis announced today that the goods and services deficit was $50.0 billion in March, up $0.7 billion from $49.3 billion in February, revised.

Exports, Imports, and Balance (exhibit 1)
March exports were $212.0 billion, $2.1 billion more than February exports. March imports were $262.0 billion, $2.8 billion more than February imports.
The March increase in the goods and services deficit reflected an increase in the goods deficit of $0.5 billion to $72.4 billion and a decrease in the services surplus of $0.2 billion to $22.4 billion.
Year-to-date, the goods and services deficit decreased $5.8 billion, or 3.7 percent, from the same period in 2018. Exports increased $14.0 billion or 2.3 percent. Imports increased $8.2 billion or 1.1 percent.
Three-Month Moving Averages (exhibit 2)
The average goods and services deficit decreased $3.3 billion to $50.1 billion for the three months ending in March.
- Average exports increased $2.2 billion to $209.7 billion in March.
- Average imports decreased $1.1 billion to $259.9 billion in March.
Year-over-year, the average goods and services deficit decreased $1.9 billion from the three months ending in March 2018.
- Average exports increased $4.7 billion from March 2018.
- Average imports increased $2.7 billion from March 2018.
Exports (exhibits 3, 6, and 7)
Exports of goods increased $2.0 billion to $141.7 billion in March.
Exports of goods on a Census basis increased $2.1 billion.
- Industrial supplies and materials increased $1.7 billion.
- Natural gas liquids increased $0.4 billion.
- Fuel oil increased $0.3 billion.
- Metallurgical grade coal increased $0.3 billion.
- Other petroleum products increased $0.3 billion.
- Foods, feeds, and beverages increased $0.8 billion.
- Soybeans increased $0.5 billion.
- Capital goods decreased $0.5 billion.
- Civilian aircraft decreased $0.7 billion.
Net balance of payments adjustments decreased $0.1 billion.
Exports of services increased less than $0.1 billion to $70.3 billion in March.
- Maintenance and repair services increased $0.1 billion.
- Financial services increased $0.1 billion.
- Transport decreased $0.1 billion.
Imports (exhibits 4, 6, and 8)
Imports of goods increased $2.6 billion to $214.1 billion in March.
Imports of goods on a Census basis increased $2.6 billion.
- Industrial supplies and materials increased $2.4 billion.
- Crude oil increased $1.4 billion.
- Organic chemicals increased $0.5 billion.
- Other petroleum products increased $0.4 billion.
- Foods, feeds, and beverages increased $1.0 billion.
- Other foods increased $0.5 billion.
- Fish and shellfish increased $0.2 billion.
- Consumer goods decreased $0.7 billion.
- Cell phones and other household goods decreased $1.1 billion.
Net balance of payments adjustments decreased $0.1 billion.
Imports of services increased $0.2 billion to $47.8 billion in March.
- Travel (for all purposes including education) increased $0.1 billion.
- Maintenance and repair services increased $0.1 billion.
- Insurance services decreased $0.1 billion.
Real Goods in 2012 Dollars – Census Basis (exhibit 11)
The real goods deficit increased $0.5 billion to $82.1 billion in March.
- Real exports of goods increased $1.0 billion to $151.8 billion.
- Real imports of goods increased $1.5 billion to $233.8 billion.
Revisions
Revisions to February exports
- Exports of goods were revised up $0.1 billion.
- Exports of services were revised up $0.1 billion.
Revisions to February imports
- Imports of goods were revised up less than $0.1 billion.
- Imports of services were revised up $0.1 billion.
Goods by Selected Countries and Areas: Monthly – Census Basis (exhibit 19)
The March figures show surpluses, in billions of dollars, with South and Central America ($4.2), Hong Kong ($2.4), Brazil ($0.9), OPEC ($0.7), Saudi Arabia ($0.3), and Singapore ($0.2). Deficits were recorded, in billions of dollars, with China ($28.3), European Union ($15.8), Mexico ($8.6), Japan ($6.1), Germany ($5.7), Italy ($2.8), Canada ($2.1), Taiwan ($2.0), South Korea ($1.8), India ($1.8), France ($1.7), and United Kingdom ($0.2).
- The deficit with the European Union increased $3.4 billion to $15.8 billion in March. Exports decreased $1.4 billion to $27.8 billion and imports increased $2.0 billion to $43.6 billion.
- The balance with Canada shifted from a surplus of $0.5 billion to a deficit of $2.1 billion in March. Exports decreased $0.1 billion to $25.3 billion and imports increased $2.6 billion to $27.5 billion.
- The deficit with China decreased $1.9 billion to $28.3 billion in March. Exports increased $1.4 billion to $10.5 billion and imports decreased $0.5 billion to $38.8 billion.
----
Earlier:
2019, May, 6, 11:35:00
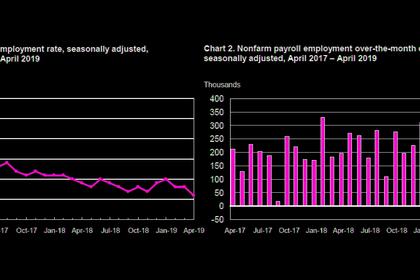
U.S. UNEMPLOYMENT DOWN TO 3.6%
Total nonfarm payroll employment increased by 263,000 in April, and the unemployment rate declined to 3.6 percent, the U.S. Bureau of Labor Statistics reported
2019, May, 2, 16:25:00
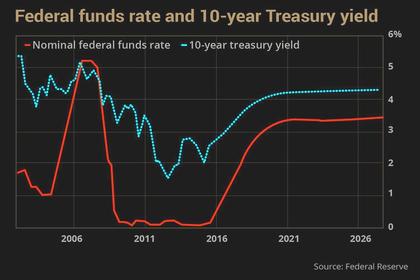
U.S. FEDERAL FUNDS RATE 2.25 - 2.5%
Consistent with its statutory mandate, the Committee seeks to foster maximum employment and price stability. In support of these goals, the Committee decided to maintain the target range for the federal funds rate at 2-1/4 to 2-1/2 percent.

2019, April, 29, 11:50:00
MULTI TRILLION DOLLAR ENERGY MARKET
Most of the systems in the U.S. were constructed in the 50s and 60s and they had a life expectancy of 50 years. Today, almost all operate at maximum capacity and they are all stretched to the limit. With population growth, spiraling demand, changes in power generation and mandates for the use of clean and renewable energy sources, change must come quickly.
2019, April, 29, 11:10:00
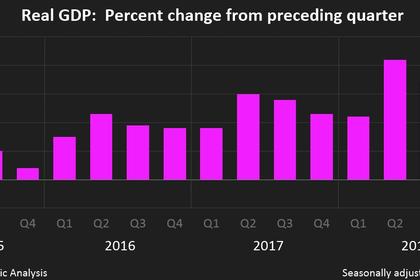
U.S. GDP UP 3.2%
U.S. Real gross domestic product (GDP) increased at an annual rate of 3.2 percent in the first quarter of 2019, according to the "advance" estimate released by the Bureau of Economic Analysis. In the fourth quarter of 2018, real GDP increased 2.2 percent.
2019, April, 19, 09:05:00
U.S. TRADE DEFICIT $49.4 BLN
the goods and services deficit was $49.4 billion in February, down $1.8 billion from $51.1 billion in January,
2019, April, 17, 11:25:00
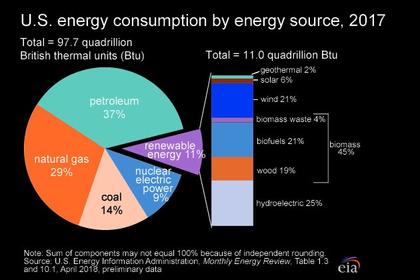
U.S. ENERGY CONSUMPTION UP 4%
U.S. EIA - Primary energy consumption in the United States reached a record high of 101.3 quadrillion British thermal units (Btu) in 2018, up 4% from 2017 and 0.3% above the previous record set in 2007. The increase in 2018 was the largest increase in energy consumption, in both absolute and percentage terms, since 2010.
2019, April, 17, 10:55:00
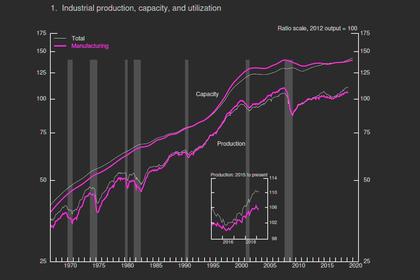
U.S. INDUSTRIAL PRODUCTION DOWN 0.1%
U.S. FRB - Industrial production edged down 0.1 percent in March after edging up 0.1 percent in February; for the first quarter as a whole, the index slipped 0.3 percent at an annual rate.


