2019-05-06 11:35:00
U.S. UNCOMPLETED WELLS UP
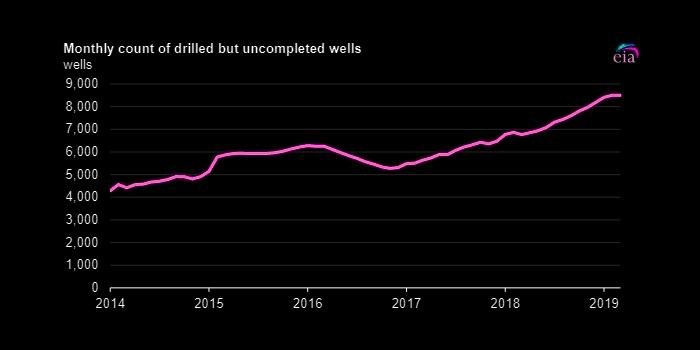
U.S. EIA - The number of drilled but uncompleted wells in seven key oil and natural gas production regions in the United States has increased over the last two years, reaching a high of 8,504 wells in February 2019, according to well counts in EIA's Drilling Productivity Report (DPR). The most recent count, at 8,500 wells in March 2019, was 26% higher than the previous March.
Drilled but uncompleted wells, also known as DUCs, are oil and natural gas wells that have been drilled but have not yet undergone well completion activities to start producing hydrocarbons. The well completion process involves casing, cementing, perforating, hydraulic fracturing, and other procedures required to produce crude oil or natural gas.

The number of DUCs has generally increased since the end of 2016. A high inventory of DUCs may be attributable to economic factors or resource constraints. For example, a low oil and natural gas price environment may postpone well completion activities in areas where the wellhead break-even price is too high relative to the current market price. Another example may be the lack of available well completion crews to perform hydraulic fracture activities in areas of high demand. Takeaway capacity, or the ability to transport hydrocarbons through pipelines away from the resource, may also place additional constraints when pipeline networks are insufficient to accommodate supply.
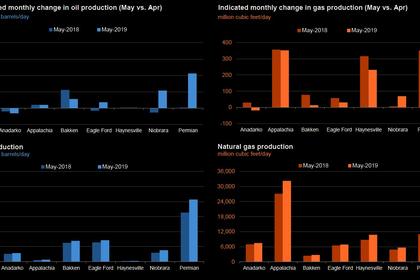
Most of the recent increase in the DUC count has been in regions dominated by oil production, especially the Permian region that spans western Texas and eastern New Mexico. As of March 2019, nearly half of the total DUCs included in the DPR were in the Permian region. The Permian Basin experienced takeaway constraints in the second half of 2018, but recent pipeline capacity additions in the region have reduced some of the takeaway constraints. Other pipeline projects are planned or currently under construction.

In contrast to oil-directed regions, the number of DUCs in natural gas-dominated DPR regions such as the Appalachian and Haynesville regions has decreased by nearly half over the past three years, from 1,230 wells in March 2016 to 713 wells in March 2019. New pipelines in these regions have increased the ability to transport natural gas to demand centers in the Northeast and Midwest.
Production in the seven DPR regions, which are characterized by tight oil or shale gas formations, totaled 8.2 million barrels per day of crude oil and 77.1 billion cubic feet per day of natural gas in February 2019, or 70% of total U.S. crude oil production and 71% of total U.S. natural gas production.
-----
Earlier:
2019, April, 29, 10:50:00
U.S. RIGS DOWN 21 TO 991
BHGE - U.S. Rig Count is down 21 rigs from last week to 991, with oil rigs down 20 to 805, gas rigs down 1 to 186, and miscellaneous rigs unchanged at 0. Canada Rig Count is down 3 rigs from last week to 63, with oil rigs unchanged at 19 and gas rigs down 3 to 44.
2019, April, 19, 09:40:00
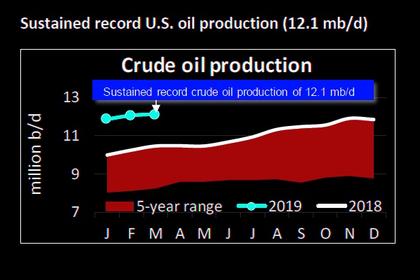
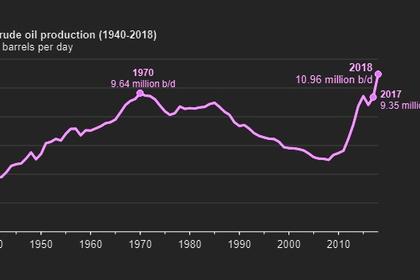
U.S. OIL PRODUCTION 12.1 MBD
the U.S. sustained its position as the world’s leading oil producer, continuing a pace of 12.1 million barrels a day (mb/d), matching February 2019. In addition, petroleum demand in March was the strongest for that month in more than a decade at 20.7 mb/d.
2019, April, 17, 11:25:00
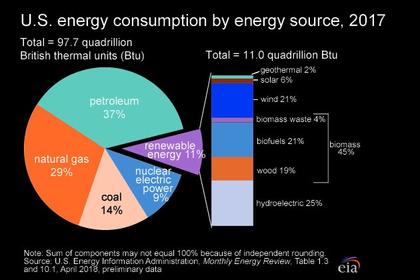
U.S. ENERGY CONSUMPTION UP 4%
U.S. EIA - Primary energy consumption in the United States reached a record high of 101.3 quadrillion British thermal units (Btu) in 2018, up 4% from 2017 and 0.3% above the previous record set in 2007. The increase in 2018 was the largest increase in energy consumption, in both absolute and percentage terms, since 2010.
2019, April, 17, 11:20:00
U.S. PRODUCTION: OIL + 85 TBD, GAS + 883 MCFD
U.S. EIA - Crude oil production from the major US onshore regions is forecast to increase 80,000 b/d month-over-month in April from 8,380 to 8,460 thousand barrels/day , gas production to increase 907 million cubic feet/day from 78,930 to 79,837 million cubic feet/day .
2019, April, 15, 11:30:00
U.S. RIGS DOWN 3 TO 1,022
BHGE - U.S. Rig Count is down 3 rigs from last week to 1,022, with oil rigs up 2 to 833, gas rigs down 5 to 189, and miscellaneous rigs unchanged at 0. Canada Rig Count is down 2 rigs from last week to 66, with oil rigs down 4 to 18 and gas rigs up 2 to 48.
2019, April, 10, 10:40:00
U.S. SHALE OIL JOBS CUTS
Having slashed spending plans and run out of willing buyers for assets, some U.S. shale producers are turning to workforce cuts as investors step up demands for returns.


