2019-06-07 11:55:00


U.S. LNG TO EUROPE UP
U.S. EIA - U.S. LNG exports to Europe increase amid declining demand and spot LNG prices in Asia
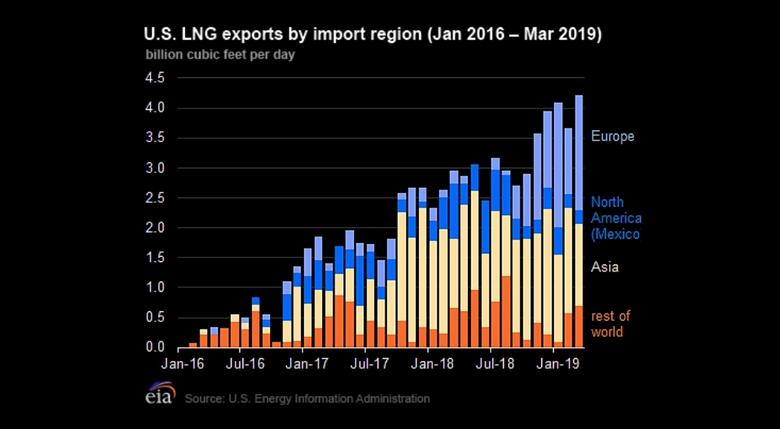
U.S. exports of liquefied natural gas (LNG) to Europe have increased substantially since October 2018, averaging 1.9 billion cubic feet per day (Bcf/d) in the winter of 2018–19 compared with 0.1 Bcf/d in the winter of 2017–18. U.S. LNG exports to Europe increased primarily as a result of tepid LNG demand in Asia because of warm winter, declining price differentials between European and Asian spot natural gas prices, and additional U.S. LNG supply that came online in the fourth quarter of 2018, increasing available global spot LNG supply. In March and April 2019, U.S. LNG exports to Europe averaged 1.7 Bcf/d, ten times higher than in the same months of last year, and accounted for more than one-third of all U.S. LNG exports in those months. Most of the U.S. LNG exports to Europe were sent from the Sabine Pass terminal in Louisiana.

Europe's LNG imports in the winter months of 2018–19 averaged 10.2 Bcf/d, 60% higher than in the previous two winters and the highest winter average since at least 2013, according to CEDIGAZ LNG data. Russia, Nigeria and the United States were the three largest LNG suppliers to Europe from January through April 2019 (based on a four-month average), according to CEDIGAZ data. LNG imports have increased primarily in northwest Europe (Belgium, the Netherlands, and the United Kingdom) and southern Europe (France and Italy) during this period. LNG imports in Europe have been relatively low in recent years, but are expected to grow as new LNG supply comes online and European countries continue to increase natural gas consumption as part of their decarbonization initiatives.

LNG imports in the three largest global LNG markets (Japan, China, and South Korea), all located in northern Asia, remained high from November 2018 through January 2019, but started to decrease in February 2019 and remained low in subsequent months, consistent with seasonal consumption patterns. China, which has become world's second largest LNG importer in 2017 overtaking South Korea, and also the world's largest importer of natural gas in 2018 overtaking Japan, continued to increase LNG imports in the winter 2018-19. China LNG imports averaged 9.1 Bcf/d from December 2018 through February 2019, 20% higher than in the winter of 2018–19. During the same period, LNG imports in Japan and South Korea have declined by 10% and 5%, respectively, in part because of milder winter weather and nuclear restarts in Japan.

Declining price differentials between National Balancing Point (NBP) in the United Kingdom and Japan LNG spot prices affected the flow of flexible (i.e. without a fixed destination) U.S. LNG exports, which follow global spot natural gas price benchmarks. Because the transportation costs from the U.S. Gulf Coast to Europe are about $1.50 per million British thermal units (MMBtu) lower than those to Asian markets (for a round trip), a sufficiently narrow differential will make U.S. LNG exports to Europe more economical. The price differentials between Japan spot LNG and NBP prices were less than $1.00/MMBtu in December 2018 and January 2019 and reached a low of $0.60/MMBtu in April, which supported continued high U.S. LNG exports to Europe.
-----
Earlier:
2019, June, 6, 14:40:00
U.S. LNG PRICES FOR UKRAINE
The United States has strongly criticised Nord Stream 2, a 11 billion euro ($12.4 billion) project to build a gas pipeline from Russia to Germany, which opponents fear will undermine Ukraine’s gas transit revenues and increase the EU’s reliance on Russian gas.
2019, June, 3, 12:30:00
U.S. GAS PRODUCTION UP
In March 2019, for the 23rd consecutive month, dry natural gas production increased year to year for the month. The preliminary level for dry natural gas production in March 2019 was 2,771 billion cubic feet (Bcf), or 89.4 Bcf/d. This level was 9.2 Bcf/d (11.5%) higher than the March 2018 level of 80.2 Bcf/d.


