2019-06-17 12:10:00
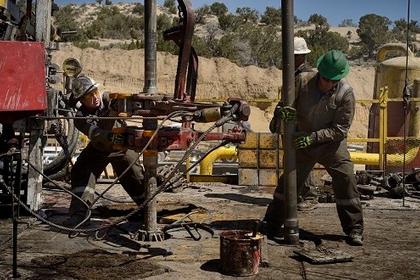
U.S. RIGS DOWN 6 TO 969
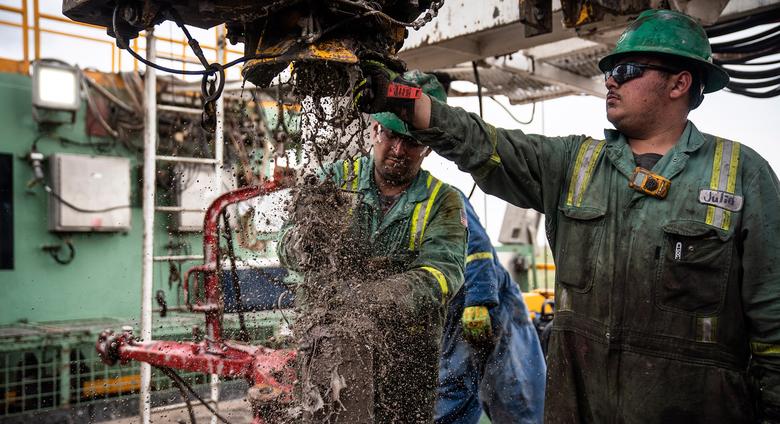
BHGE - U.S. Rig Count is down 6 rigs from last week to 969, with oil rigs down 1 to 788, gas rigs down 5 to 181, and miscellaneous rigs unchanged at 0.
U.S. Rig Count is down 90 rigs from last year's count of 1,059, with oil rigs down 75, gas rigs down 13, and miscellaneous rigs down 2.
The U.S. Offshore Rig Count is up 1 rig to 24 and up 4 rigs year-over-year.
Canada Rig Count is up 4 rigs from last week to 107, with oil rigs up 10 to 69 and gas rigs down 6 to 38.
Canada Rig Count is down 32 rigs from last year's count of 139, with oil rigs down 18 and gas rigs down 14.
| Rotary Rig Count | |||||||||
| 6/14/19 | |||||||||
| Week | Year | ||||||||
| Location | Week | +/- | Ago | +/- | Ago | ||||
| Land | 941 | -7 | 948 | -94 | 1035 | ||||
| Inland Waters | 4 | 0 | 4 | 0 | 4 | ||||
| Offshore | 24 | 1 | 23 | 4 | 20 | ||||
| United States Total | 969 | -6 | 975 | -90 | 1059 | ||||
| Gulf Of Mexico | 24 | 1 | 23 | 5 | 19 | ||||
| Canada | 107 | 4 | 103 | -32 | 139 | ||||
| North America | 1076 | -2 | 1078 | -122 | 1198 | ||||
| U.S. Breakout Information | This Week | +/- | Last Week | +/- | Year Ago | ||||
| Oil | 788 | -1 | 789 | -75 | 863 | ||||
| Gas | 181 | -5 | 186 | -13 | 194 | ||||
| Miscellaneous | 0 | 0 | 0 | -2 | 2 | ||||
| Directional | 68 | -6 | 74 | 1 | 67 | ||||
| Horizontal | 852 | -3 | 855 | -80 | 932 | ||||
| Vertical | 49 | 3 | 46 | -11 | 60 | ||||
| Canada Breakout Information | This Week | +/- | Last Week | +/- | Year Ago | ||||
| Oil | 69 | 10 | 59 | -18 | 87 | ||||
| Gas | 38 | -6 | 44 | -14 | 52 | ||||
| Major State Variances | This Week | +/- | Last Week | +/- | Year Ago | ||||
| Alaska | 5 | -1 | 6 | -2 | 7 | ||||
| Arkansas | 0 | 0 | 0 | -1 | 1 | ||||
| California | 18 | 0 | 18 | 3 | 15 | ||||
| Colorado | 31 | 0 | 31 | -2 | 33 | ||||
| Louisiana | 70 | 2 | 68 | 10 | 60 | ||||
| New Mexico | 101 | 0 | 101 | 8 | 93 | ||||
| North Dakota | 56 | 0 | 56 | -1 | 57 | ||||
| Ohio | 18 | 0 | 18 | -4 | 22 | ||||
| Oklahoma | 101 | 0 | 101 | -39 | 140 | ||||
| Pennsylvania | 39 | 0 | 39 | 1 | 38 | ||||
| Texas | 467 | -6 | 473 | -67 | 534 | ||||
| Utah | 6 | 0 | 6 | -2 | 8 | ||||
| West Virginia | 19 | 0 | 19 | 2 | 17 | ||||
| Wyoming | 31 | -1 | 32 | 6 | 25 | ||||
| Major Basin Variances | This Week | +/- | Last Week | +/- | Year Ago | ||||
| Ardmore Woodford | 6 | 0 | 6 | 3 | 3 | ||||
| Arkoma Woodford | 3 | 0 | 3 | -5 | 8 | ||||
| Barnett | 1 | 0 | 1 | -3 | 4 | ||||
| Cana Woodford | 44 | 0 | 44 | -28 | 72 | ||||
| DJ-Niobrara | 28 | 0 | 28 | 2 | 26 | ||||
| Eagle Ford | 73 | -1 | 74 | -9 | 82 | ||||
| Granite Wash | 8 | 0 | 8 | -8 | 16 | ||||
| Haynesville | 53 | 0 | 53 | -1 | 54 | ||||
| Marcellus | 58 | 0 | 58 | 4 | 54 | ||||
| Mississippian | 4 | 0 | 4 | -2 | 6 | ||||
| Permian | 441 | -5 | 446 | -35 | 476 | ||||
| Utica | 18 | 0 | 18 | -5 | 23 | ||||
| Williston | 56 | 0 | 56 | -1 | 57 | ||||
-----
Earlier:
2019, June, 14, 11:20:00
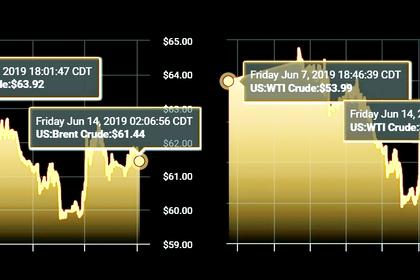
OIL PRICE: ABOVE $61 AGAIN
Brent crude futures were up 23 cents, or 0.4%, at $61.54 a barrel by 0638 GMT, having settled up 2.2% on Thursday. U.S. West Texas Intermediate crude futures were down 1 cent at $52.27 a barrel, after earlier rising. WTI also closed up 2.2% in the previous session, but is on course for a weekly decline of 3.2%.
2019, June, 14, 11:05:00
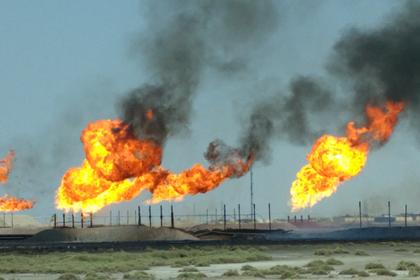
GLOBAL GAS FLARING UP 3%
Gas flaring, the burning of natural gas associated with oil extraction, takes place because of technical, regulatory, and/or economic constraints. It results in more than 350 million tons of CO2 equivalent emissions every year and wastes a valuable resource, with harmful impacts to the environment from un-combusted methane and black carbon emissions.
2019, June, 13, 16:40:00
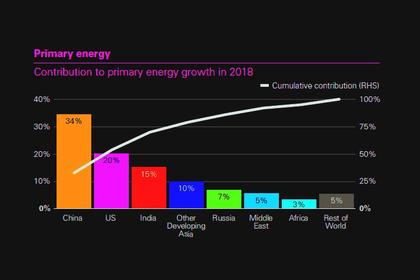
GLOBAL ENERGY DEMAND +2.9%
Primary energy consumption grew at a rate of 2.9% last year, almost double its 10-year average of 1.5% per year, and the fastest since 2010.
2019, June, 11, 09:20:00
U.S. RIGS DOWN 9 TO 975
BHGE - U.S. Rig Count is down 9 rigs from last week to 975, with oil rigs down 11 to 789, gas rigs up 2 to 186, and miscellaneous rigs unchanged at 0. Canada Rig Count is up 18 rigs from last week to 103, with oil rigs up 15 to 59 and gas rigs up 3 to 44.
2019, June, 7, 11:55:00
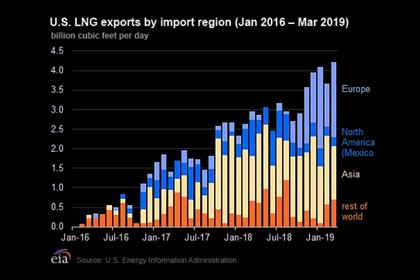
U.S. LNG TO EUROPE UP
U.S. exports of liquefied natural gas (LNG) to Europe have increased substantially since October 2018, averaging 1.9 billion cubic feet per day (Bcf/d) in the winter of 2018–19 compared with 0.1 Bcf/d in the winter of 2017–18.
2019, June, 6, 14:55:00
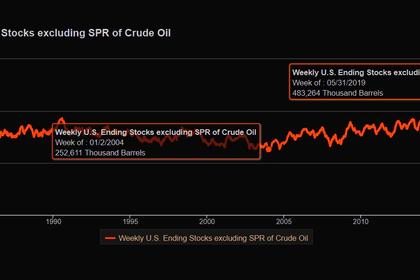
U.S. OIL INVENTORIES UP 6.8 MB
US crude oil inventories for the week ended May 31, excluding the Strategic Petroleum Reserve, increased by 6.8 million bbl from the previous week, according to data from the US Energy Information Administration.
2019, June, 6, 14:40:00
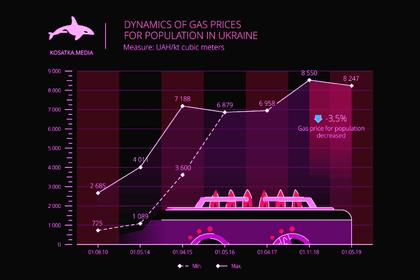
U.S. LNG PRICES FOR UKRAINE
The United States has strongly criticised Nord Stream 2, a 11 billion euro ($12.4 billion) project to build a gas pipeline from Russia to Germany, which opponents fear will undermine Ukraine’s gas transit revenues and increase the EU’s reliance on Russian gas.


