2019-06-07 11:35:00
U.S. TRADE DEFICIT UPDOWN ANEW
U.S. BEA - U.S. International Trade in Goods and Services, April 2019
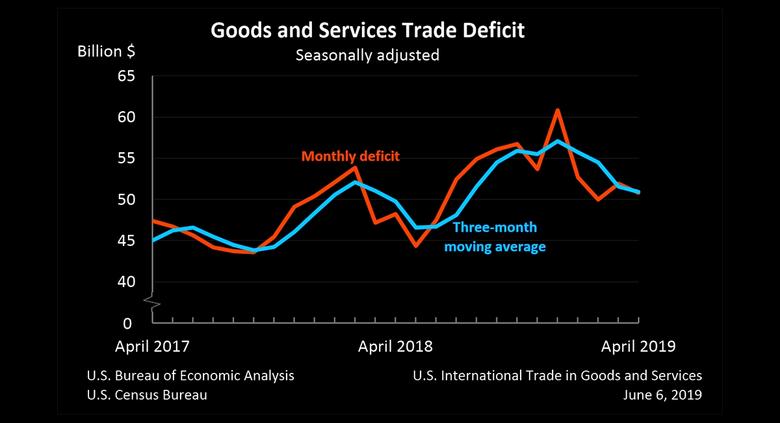
The U.S. Census Bureau and the U.S. Bureau of Economic Analysis announced today that the goods and services deficit was $50.8 billion in April, down $1.1 billion from $51.9 billion in March, revised.
| Deficit: | $50.8 Billion | -2.1%° |
| Exports: | $206.8 Billion | -2.2%° |
| Imports: | $257.6 Billion | -2.2%° |
|
Next release: July 3, 2019 (°) Statistical significance is not applicable or not measurable. Source: U.S. Census Bureau, U.S. Bureau of Economic Analysis; U.S. International Trade in Goods and Services, June 6, 2019 |
||
Exports, Imports, and Balance (exhibit 1)
April exports were $206.8 billion, $4.6 billion less than March exports. April imports were $257.6 billion, $5.7 billion less than March imports.
The April decrease in the goods and services deficit reflected a decrease in the goods deficit of $1.0 billion to $71.7 billion and an increase in the services surplus of $0.1 billion to $20.9 billion.
Year-to-date, the goods and services deficit increased $4.1 billion, or 2.0 percent, from the same period in 2018. Exports increased $8.3 billion or 1.0 percent. Imports increased $12.4 billion or 1.2 percent.
Three-Month Moving Averages (exhibit 2)
The average goods and services deficit decreased $0.6 billion to $50.9 billion for the three months ending in April.
- Average exports decreased $0.2 billion to $209.3 billion in April.
- Average imports decreased $0.8 billion to $260.2 billion in April.
Year-over-year, the average goods and services deficit increased $1.2 billion from the three months ending in April 2018.
- Average exports increased $1.2 billion from April 2018.
- Average imports increased $2.3 billion from April 2018.
Exports (exhibits 3, 6, and 7)
Exports of goods decreased $4.4 billion to $136.9 billion in April.
Exports of goods on a Census basis decreased $4.5 billion.
- Capital goods decreased $2.7 billion.
- Civilian aircraft decreased $2.3 billion.
- Automotive vehicles, parts, and engines decreased $0.8 billion.
- Passenger cars decreased $0.4 billion.
- Automotive parts and accessories decreased $0.3 billion.
- Consumer goods decreased $0.6 billion.
- Pharmaceutical preparations decreased $0.4 billion.
Net balance of payments adjustments increased $0.1 billion.
Exports of services decreased $0.2 billion to $69.9 billion in April.
- Travel (for all purposes including education) decreased $0.1 billion.
- Maintenance and repair services decreased $0.1 billion.
Imports (exhibits 4, 6, and 8)
Imports of goods decreased $5.4 billion to $208.7 billion in April.
Imports of goods on a Census basis decreased $5.4 billion.
- Capital goods decreased $1.7 billion.
- Semiconductors decreased $0.9 billion.
- Civilian aircraft engines decreased $0.4 billion.
- Consumer goods decreased $1.1 billion.
- Gem diamonds decreased $0.7 billion.
- Automotive vehicles, parts, and engines decreased $1.0 billion.Other goods decreased $0.8 billion.
- Passenger cars decreased $0.6 billion.
- Industrial supplies and materials decreased $0.6 billion.
Net balance of payments adjustments decreased less than $0.1 billion.
Imports of services decreased $0.3 billion to $49.0 billion in April.
- Transport decreased $0.3 billion.
Real Goods in 2012 Dollars – Census Basis (exhibit 11)
The real goods deficit decreased $1.1 billion to $81.9 billion in April.
- Real exports of goods decreased $5.1 billion to $146.0 billion.
- Real imports of goods decreased $6.2 billion to $227.9 billion.
Revisions
Exports and imports of goods and services for all months through March 2019 shown in this release reflect the incorporation of annual revisions to the goods and services series. See the "Notice" in this release for a description of the revisions.
Revisions to March exports
- Exports of goods were revised down $0.4 billion.
- Exports of services were revised down $0.2 billion.
Revisions to March imports
- Imports of goods were revised down $0.1 billion.
- Imports of services were revised up $1.4 billion.
Goods by Selected Countries and Areas: Monthly – Census Basis (exhibit 19)
The April figures show surpluses, in billions of dollars, with South and Central America ($4.2), Hong Kong ($2.4), Brazil ($0.9), and Singapore ($0.6). Deficits were recorded, in billions of dollars, with China ($29.4), European Union ($15.1), Mexico ($7.9), Japan ($6.5), Germany ($5.4), Italy ($3.1), Taiwan ($2.0), France ($2.0), Canada ($1.8), South Korea ($1.5), India ($1.3), United Kingdom ($0.4), Saudi Arabia ($0.2), and OPEC (less than $0.1).
- The deficit with the European Union decreased $1.0 billion to $15.1 billion in April. Exports decreased $0.4 billion to $27.0 billion and imports decreased $1.4 billion to $42.1 billion.
- The deficit with Canada decreased $0.9 billion to $1.8 billion in April. Exports decreased $0.4 billion to $24.6 billion and imports decreased $1.3 billion to $26.4 billion.
- The deficit with China increased $2.1 billion to $29.4 billion in April. Exports decreased $1.8 billion to $8.5 billion and imports increased $0.3 billion to $37.9 billion.
Goods and Services by Selected Countries and Areas: Quarterly – Balance of Payments Basis (exhibit 20)
Statistics on trade in goods and services by country and area are only available quarterly, with a one-month lag. With this release, first-quarter figures are now available.
The first-quarter figures show surpluses, in billions of dollars, with South and Central America ($22.3), Brazil ($8.1), Hong Kong ($7.4), OPEC ($6.6), United Kingdom ($5.0), Singapore ($4.2), Canada ($4.0), and Saudi Arabia ($1.5). Deficits were recorded, in billions of dollars, with China ($80.8), European Union ($28.4), Mexico ($23.0), Germany ($16.7), Japan ($15.6), Italy ($9.4), India ($7.1), Taiwan ($5.0), France ($4.6), and South Korea ($4.1).
- The deficit with China decreased $22.9 billion to $80.8 billion in the first quarter. Exports increased $4.9 billion to $41.4 billion and imports decreased $18.0 billion to $122.2 billion.
- The balance with Saudi Arabia shifted from a deficit of $2.5 billion to a surplus of $1.5 billion in the first quarter. Exports increased $1.0 billion to $6.3 billion and imports decreased $3.0 billion to $4.8 billion.
- The deficit with South Korea increased $1.8 billion to $4.1 billion in the first quarter. Exports decreased $1.5 billion to $19.7 billion and imports increased $0.3 billion to $23.8 billion.
----
Earlier:
2019, June, 6, 14:55:00
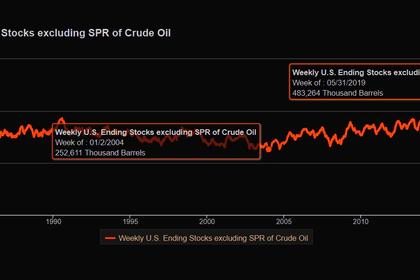
U.S. OIL INVENTORIES UP 6.8 MB
US crude oil inventories for the week ended May 31, excluding the Strategic Petroleum Reserve, increased by 6.8 million bbl from the previous week, according to data from the US Energy Information Administration.
2019, May, 30, 17:50:00
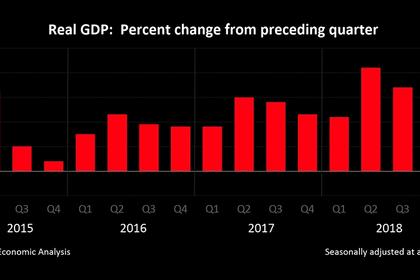
U.S. GDP UP 3.1%
U.S. real gross domestic product (GDP) increased at an annual rate of 3.1 percent in the first quarter of 2019 (table 1), according to the "second" estimate released by the Bureau of Economic Analysis. In the fourth quarter, real GDP increased 2.2 percent.
2019, May, 20, 11:10:00
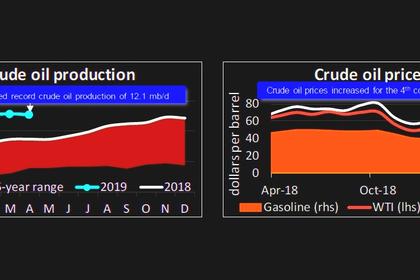
U.S. OIL PRODUCTION 12.1 MBD
U.S. crude oil production sustained a record-tying 12.1 million barrels per day (mb/d) in April while total petroleum demand was the highest for the month since 2007 at 20.2 million barrels per day.


