2019-07-01 11:30:00
U.S. GAS PRODUCTION UP 12%
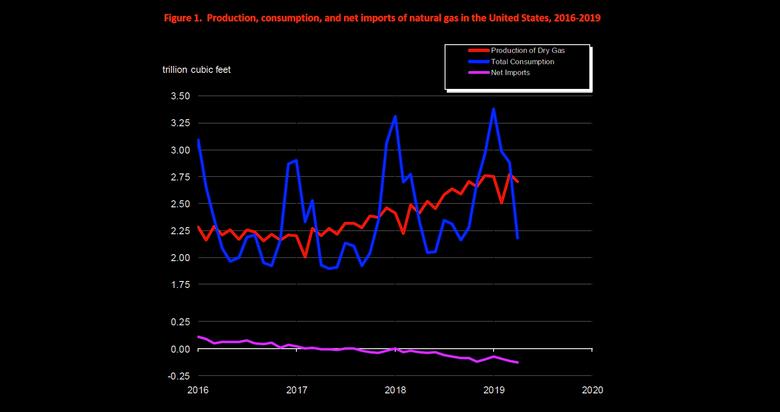
U.S. EIA - In April 2019, for the 24th consecutive month, dry natural gas production increased year to year for the month. The preliminary level for dry natural gas production in April 2019 was 2,708 billion cubic feet (Bcf), or 90.3 Bcf/d. This level was 9.8 Bcf/d (12.2%) higher than the April 2018 level of 80.4 Bcf/d. The average daily rate of dry natural gas production for April was the highest for any month since EIA began tracking monthly dry natural gas production in 1973.
The estimated natural gas consumption level in April 2019 was 2,183 Bcf, or 72.8 Bcf/d. This level was 5.1 Bcf/d (6.5%) lower than the 77.9 Bcf/d consumed in April 2018. April 2019 was only the second month since October 2017 that saw a year-to-year decrease in natural gas consumption. Despite this decrease, natural gas consumption for April was the second-highest level for the month since 2001, when EIA began using the current definitions for consuming sectors
Year-over-year total consumption of dry natural gas in April 2019 decreased in three of the four consuming sectors. Deliveries of natural gas by consuming sector in April 2019 were:
- Residential deliveries: 327 Bcf, or 10.9 Bcf/d, which was down 25.5% compared with 14.6 Bcf/d in April 2018.
- Commercial deliveries: 246 Bcf, or 8.2 Bcf/d, which was down 17.7% compared with 10.0 Bcf/d in April 2018.
- Industrial deliveries: 667 Bcf, or 22.2 Bcf/d, which was down 2.9% compared with 22.9 Bcf/d in April 2018. Despite this decrease, industrial deliveries were the second highest for the month since EIA began using the current definitions for consuming sectors in 2001.
- Electric power deliveries: 724 Bcf, or 24.1 Bcf/d, which was up 2.4% compared with 23.6 Bcf/d in April 2018. Electric power deliveries were the highest for the month since EIA began using the current definitions for consuming sectors in 2001.
Net natural gas imports (imports minus exports) were -130 Bcf, or -4.3 Bcf/d, in April 2019, making the United States a net exporter. Total imports were 6.9 Bcf/d, a decrease of 14.5% compared with 8.1 Bcf/d in April 2018. Total exports were 11.2 Bcf/d, an increase of 20.4% compared with 9.3 Bcf/d in April 2018. Natural gas exports were the highest for the month since EIA began tracking monthly exports in 1973. The increase in exports continues to be driven by liquefied natural gas (LNG). LNG exports in April 2019 were 47.7% higher than in April 2018. In April 2019, the United States exported 4.2 Bcf/d of LNG to 22 countries. The average daily rate of LNG exports was the highest for any month since EIA began tracking them in 1997.
-----
Earlier:
2019, June, 25, 12:45:00
GAS DEMAND WILL UP 46%
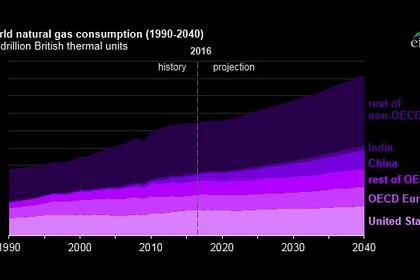
Dr. Sentyurin also highlighted that - according to the Forum’s projections - by 2040, the demand for natural gas is expected to increase at an annual average pace of 1.7%, corresponding to overall growth of 46%. Most of this demand growth will come from the Asia-Pacific region, with Europe continuing to be an attractive market for many gas producers.
2019, June, 18, 17:20:00
U.S. PRODUCTION: OIL + 70 TBD, GAS + 798 MCFD
U.S. EIA - Crude oil production from the major US onshore regions is forecast to increase 70,000 b/d month-over-month in June from 8,450 to 8,8,520 thousand barrels/day, gas production to increase 798 million cubic feet/day from 80,564 to 81,362 million cubic feet/day .


