2019-07-20 13:05:00
U.S. PRODUCTION: OIL + 49 TBD, GAS + 745 MCFD
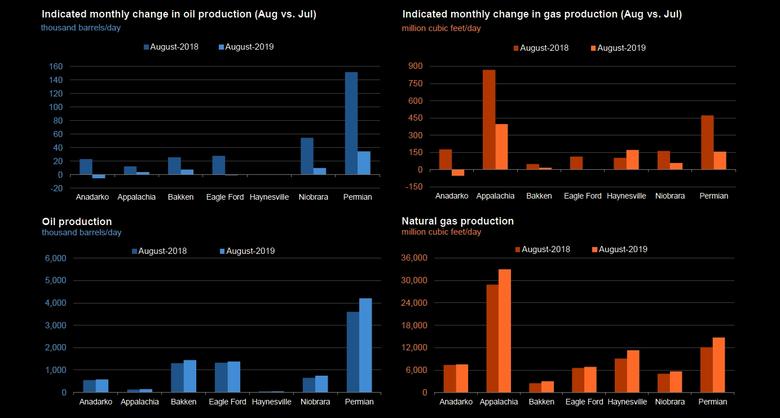
U.S. EIA - Crude oil production from the major US onshore regions is forecast to increase 49,000 b/d month-over-month in July from 8,497 to 8,546 thousand barrels/day, gas production to increase 745 million cubic feet/day from 81,213 to 81,958 million cubic feet/day .
| Oil production thousand barrels/day | Gas production million cubic feet/day | |||||
|---|---|---|---|---|---|---|
| Region | July 2019 | August 2019 | change | July 2019 | August 2019 | change |
| Anadarko | 590 | 585 | (5) | 7,565 | 7,511 | (54) |
| Appalachia | 138 | 142 | 4 | 32,573 | 32,969 | 396 |
| Bakken | 1,435 | 1,442 | 7 | 2,999 | 3,015 | 16 |
| Eagle Ford | 1,383 | 1,382 | (1) | 6,846 | 6,848 | 2 |
| Haynesville | 43 | 43 | - | 11,105 | 11,277 | 172 |
| Niobrara | 736 | 746 | 10 | 5,578 | 5,634 | 56 |
| Permian | 4,172 | 4,206 | 34 | 14,547 | 14,704 | 157 |
| Total | 8,497 | 8,546 | 49 | 81,213 | 81,958 | 745 |
| New-well oil production per rig barrels/day | New-well gas production per rig thousand cubic feet/day | |||||
|---|---|---|---|---|---|---|
| Region | July 2019 | August 2019 | change | July 2019 | August 2019 | change |
| Anadarko | 437 | 443 | 6 | 2,858 | 2,862 | 4 |
| Appalachia | 142 | 142 | - | 17,836 | 17,831 | (5) |
| Bakken | 1,409 | 1,424 | 15 | 2,044 | 2,069 | 25 |
| Eagle Ford | 1,346 | 1,350 | 4 | 4,824 | 4,836 | 12 |
| Haynesville | 26 | 26 | - | 10,116 | 10,122 | 6 |
| Niobrara | 1,232 | 1,234 | 2 | 4,448 | 4,476 | 28 |
| Permian | 672 | 684 | 12 | 1,211 | 1,217 | 6 |
| Rig-weighted average | 705 | 715 | 10 | 4,064 | 4,054 | (10) |
| Drilled but uncompleted wells (DUC) | |||
| wells | |||
| Region | May 2019 | June 2019 | change |
| Anadarko | 968 | 939 | -29 |
| Appalachia | 447 | 432 | -15 |
| Bakken | 709 | 694 | -15 |
| Eagle Ford | 1,518 | 1,519 | 1 |
| Haynesville | 192 | 189 | -3 |
| Niobrara | 495 | 473 | -22 |
| Permian | 3,96 | 4,002 | 42 |
| Total | 8,289 | 8,248 | -41 |
-----
Earlier:
2019, July, 4, 16:20:00
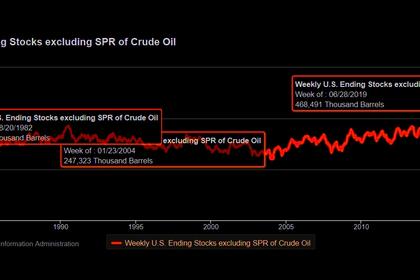
U.S. OIL INVENTORIES DOWN 1.1 MB TO 468.5 MB
US crude oil inventories for the week ended June 28, excluding the Strategic Petroleum Reserve, decreased by 1.1 million bbl from the previous week, according to data from the US Energy Information Administration.
2019, July, 2, 14:30:00
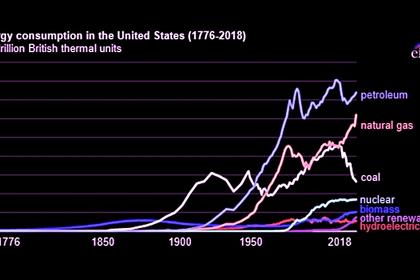
U.S. FOSSIL FUELS UP
Fossil fuels—petroleum, natural gas, and coal—have accounted for at least 80% of energy consumption in the United States for well over a century.
2019, July, 1, 11:30:00
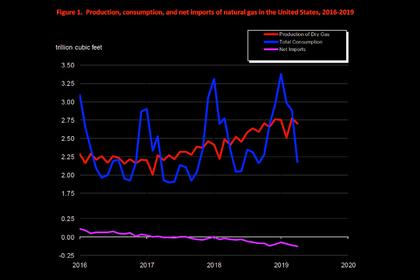
U.S. GAS PRODUCTION UP 12%
In April 2019, for the 24th consecutive month, dry natural gas production increased year to year for the month. The preliminary level for dry natural gas production in April 2019 was 2,708 billion cubic feet (Bcf), or 90.3 Bcf/d. This level was 9.8 Bcf/d (12.2%) higher than the April 2018 level of 80.4 Bcf/d.
2019, June, 24, 12:15:00
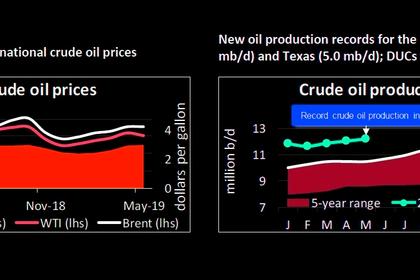
U.S. OIL PRODUCTION 12.2 MBD
U.S. crude oil production reached a new all-time high of 12.2 million barrels per day (mb/d) in May 2019


