2019-07-04 15:45:00
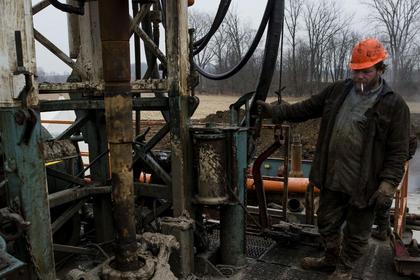
U.S. RIGS DOWN 4 TO 963
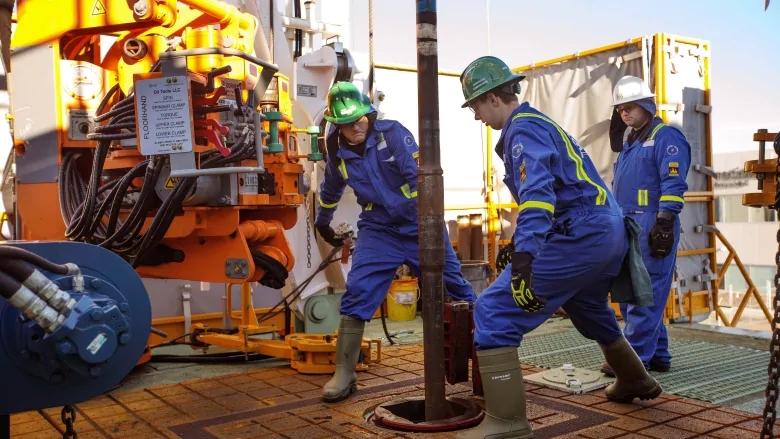
BHGE - U.S. Rig Count is down 4 rigs from last week to 963, with oil rigs down 5 to 788, gas rigs up 1 to 174, and miscellaneous rigs unchanged at 1.
U.S. Rig Count is down 89 rigs from last year's count of 1,052, with oil rigs down 75, gas rigs down 13, and miscellaneous rigs down 1.
The U.S. Offshore Rig Count is down 2 rigs from last week to 24, and up 5 rigs year-over-year.
Canada Rig Count is down 4 rigs from last week to 120, with oil rigs down 4 to 80 and gas rigs unchanged at 40.
Canada Rig Count is down 62 rigs from last year's count of 182, with oil rigs down 46 and gas rigs down 16.
| Rotary Rig Count | |||||||||
| 7/3/19 | |||||||||
| Week | Year | ||||||||
| Location | Week | +/- | Ago | +/- | Ago | ||||
| Land | 936 | -2 | 938 | -93 | 1029 | ||||
| Inland Waters | 3 | 0 | 3 | -1 | 4 | ||||
| Offshore | 24 | -2 | 26 | 5 | 19 | ||||
| United States Total | 963 | -4 | 967 | -89 | 1052 | ||||
| Gulf Of Mexico | 24 | -2 | 26 | 6 | 18 | ||||
| Canada | 120 | -4 | 124 | -62 | 182 | ||||
| North America | 1083 | -8 | 1091 | -151 | 1234 | ||||
| U.S. Breakout Information | This Week | +/- | Last Week | +/- | Year Ago | ||||
| Oil | 788 | -5 | 793 | -75 | 863 | ||||
| Gas | 174 | 1 | 173 | -13 | 187 | ||||
| Miscellaneous | 1 | 0 | 1 | -1 | 2 | ||||
| Directional | 66 | -2 | 68 | -1 | 67 | ||||
| Horizontal | 839 | -1 | 840 | -91 | 930 | ||||
| Vertical | 58 | -1 | 59 | 3 | 55 | ||||
| Canada Breakout Information | This Week | +/- | Last Week | +/- | Year Ago | ||||
| Oil | 80 | -4 | 84 | -46 | 126 | ||||
| Gas | 40 | 0 | 40 | -16 | 56 | ||||
| Major State Variances | This Week | +/- | Last Week | +/- | Year Ago | ||||
| Alaska | 9 | 2 | 7 | 2 | 7 | ||||
| Arkansas | 0 | 0 | 0 | -1 | 1 | ||||
| California | 18 | 0 | 18 | 2 | 16 | ||||
| Colorado | 29 | 0 | 29 | -2 | 31 | ||||
| Louisiana | 68 | -4 | 72 | 11 | 57 | ||||
| New Mexico | 102 | 3 | 99 | 3 | 99 | ||||
| North Dakota | 55 | 0 | 55 | -2 | 57 | ||||
| Ohio | 18 | 0 | 18 | -4 | 22 | ||||
| Oklahoma | 97 | -5 | 102 | -44 | 141 | ||||
| Pennsylvania | 37 | 0 | 37 | 0 | 37 | ||||
| Texas | 463 | -1 | 464 | -63 | 526 | ||||
| Utah | 6 | 0 | 6 | 0 | 6 | ||||
| West Virginia | 22 | 1 | 21 | 5 | 17 | ||||
| Wyoming | 32 | 0 | 32 | 5 | 27 | ||||
| Major Basin Variances | This Week | +/- | Last Week | +/- | Year Ago | ||||
| Ardmore Woodford | 6 | 0 | 6 | 4 | 2 | ||||
| Arkoma Woodford | 2 | 0 | 2 | -6 | 8 | ||||
| Barnett | 1 | 0 | 1 | -3 | 4 | ||||
| Cana Woodford | 47 | -2 | 49 | -21 | 68 | ||||
| DJ-Niobrara | 26 | 0 | 26 | 1 | 25 | ||||
| Eagle Ford | 71 | 0 | 71 | -10 | 81 | ||||
| Granite Wash | 4 | 0 | 4 | -12 | 16 | ||||
| Haynesville | 51 | -2 | 53 | 2 | 49 | ||||
| Marcellus | 59 | 1 | 58 | 6 | 53 | ||||
| Mississippian | 2 | 0 | 2 | -3 | 5 | ||||
| Permian | 443 | 2 | 441 | -32 | 475 | ||||
| Utica | 17 | 0 | 17 | -6 | 23 | ||||
| Williston | 55 | 0 | 55 | -2 | 57 | ||||
-----
Earlier:
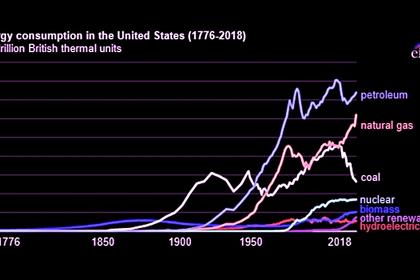
2019, July, 2, 14:30:00
U.S. FOSSIL FUELS UP
Fossil fuels—petroleum, natural gas, and coal—have accounted for at least 80% of energy consumption in the United States for well over a century.
2019, July, 1, 11:30:00
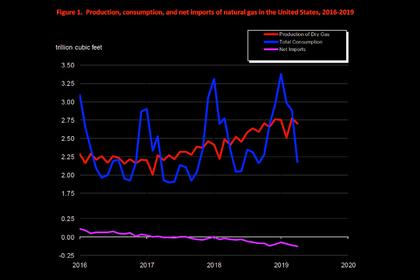
U.S. GAS PRODUCTION UP 12%
In April 2019, for the 24th consecutive month, dry natural gas production increased year to year for the month. The preliminary level for dry natural gas production in April 2019 was 2,708 billion cubic feet (Bcf), or 90.3 Bcf/d. This level was 9.8 Bcf/d (12.2%) higher than the April 2018 level of 80.4 Bcf/d.
2019, July, 1, 11:20:00
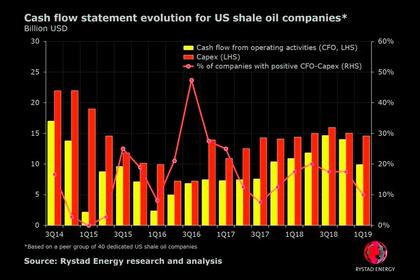
U.S. SHALE OIL PROBLEMS
Based on a study of 40 US shale oil companies, looking at cash flow from operating activities, only four companies reported a positive cash flow balance in the first quarter of 2019.
2019, July, 1, 10:55:00
U.S. RIGS UP 0 TO 967
U.S. Rig Count is unchanged from from last week at 967, with oil rigs up 4 to 793, gas rigs down 4 to 173, and miscellaneous rigs unchanged at 1. Canada Rig Count is up 5 rigs from last week to 124, with oil rigs up 4 to 84 and gas rigs up 1 to 40.
2019, June, 24, 12:15:00
U.S. OIL PRODUCTION 12.2 MBD
U.S. crude oil production reached a new all-time high of 12.2 million barrels per day (mb/d) in May 2019
2019, June, 24, 12:10:00
6 UNDERVALUED ENERGY STOCKS ANEW
Let’s see which companies are still undervalued and which ones are out of my radar. Some of them reached their fair value and some other stopped to satisfy my parameters.
2019, June, 24, 11:50:00
U.S. RIGS DOWN 2 TO 967
U.S. Rig Count is down 2 rigs from last week to 967, with oil rigs up 1 to 789, gas rigs down 4 to 177, and miscellaneous rigs up 1 to 1. Canada Rig Count is up 12 rigs from last week to 119, with oil rigs up 11 to 80 and gas rigs up 1 to 39.


