2019-07-15 12:00:00
U.S. RIGS DOWN 5 TO 958
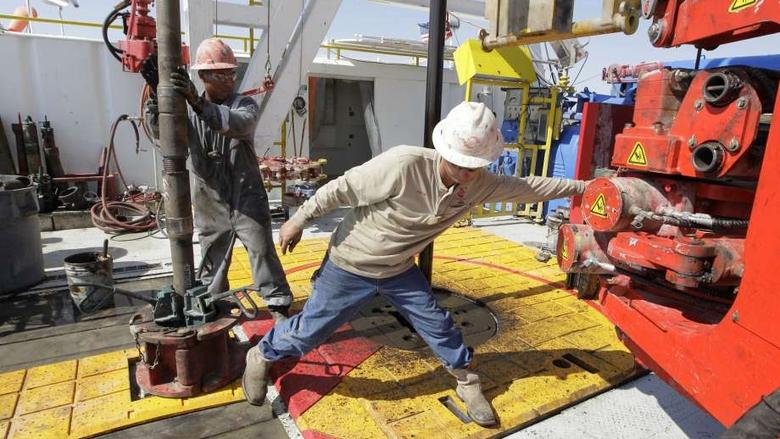
BHGE - U.S. Rig Count is down 5 rigs from last week to 958, with oil rigs down 4 to 784, gas rigs down 2 to 172, and miscellaneous rigs up 1 to 2.
U.S. Rig Count is down 96 rigs from last year's count of 1,054, with oil rigs down 79, gas rigs down 17, and miscellaneous rigs unchanged at 2.
The U.S. Offshore Rig Count is up 2 rigs to 26 and up 7 rigs year-over-year.
Canada Rig Count is down 3 rigs from last week to 117, with oil rigs up 5 to 85 and gas rigs down 8 to 32.
Canada Rig Count is down 80 rigs from last year's count of 197, with oil rigs down 54 and gas rigs down 26.
| Rotary Rig Count | |||||||||
| 7/12/19 | |||||||||
| Week | Year | ||||||||
| Location | Week | +/- | Ago | +/- | Ago | ||||
| Land | 930 | -6 | 936 | -100 | 1030 | ||||
| Inland Waters | 2 | -1 | 3 | -3 | 5 | ||||
| Offshore | 26 | 2 | 24 | 7 | 19 | ||||
| United States Total | 958 | -5 | 963 | -96 | 1054 | ||||
| Gulf Of Mexico | 26 | 2 | 24 | 7 | 19 | ||||
| Canada | 117 | -3 | 120 | -80 | 197 | ||||
| North America | 1075 | -8 | 1083 | -176 | 1251 | ||||
| U.S. Breakout Information | This Week | +/- | Last Week | +/- | Year Ago | ||||
| Oil | 784 | -4 | 788 | -79 | 863 | ||||
| Gas | 172 | -2 | 174 | -17 | 189 | ||||
| Miscellaneous | 2 | 1 | 1 | 0 | 2 | ||||
| Directional | 70 | 4 | 66 | 2 | 68 | ||||
| Horizontal | 831 | -8 | 839 | -99 | 930 | ||||
| Vertical | 57 | -1 | 58 | 1 | 56 | ||||
| Canada Breakout Information | This Week | +/- | Last Week | +/- | Year Ago | ||||
| Oil | 85 | 5 | 80 | -54 | 139 | ||||
| Gas | 32 | -8 | 40 | -26 | 58 | ||||
| Major State Variances | This Week | +/- | Last Week | +/- | Year Ago | ||||
| Alaska | 8 | -1 | 9 | 2 | 6 | ||||
| Arkansas | 0 | 0 | 0 | -1 | 1 | ||||
| California | 17 | -1 | 18 | 2 | 15 | ||||
| Colorado | 31 | 2 | 29 | -1 | 32 | ||||
| Louisiana | 69 | 1 | 68 | 11 | 58 | ||||
| New Mexico | 102 | 0 | 102 | 3 | 99 | ||||
| North Dakota | 55 | 0 | 55 | -2 | 57 | ||||
| Ohio | 18 | 0 | 18 | -4 | 22 | ||||
| Oklahoma | 98 | 1 | 97 | -43 | 141 | ||||
| Pennsylvania | 37 | 0 | 37 | 0 | 37 | ||||
| Texas | 456 | -7 | 463 | -72 | 528 | ||||
| Utah | 6 | 0 | 6 | 0 | 6 | ||||
| West Virginia | 22 | 0 | 22 | 5 | 17 | ||||
| Wyoming | 32 | 0 | 32 | 5 | 27 | ||||
| Major Basin Variances | This Week | +/- | Last Week | +/- | Year Ago | ||||
| Ardmore Woodford | 6 | 0 | 6 | 4 | 2 | ||||
| Arkoma Woodford | 2 | 0 | 2 | -6 | 8 | ||||
| Barnett | 1 | 0 | 1 | -3 | 4 | ||||
| Cana Woodford | 48 | 1 | 47 | -21 | 69 | ||||
| DJ-Niobrara | 27 | 1 | 26 | 2 | 25 | ||||
| Eagle Ford | 66 | -5 | 71 | -15 | 81 | ||||
| Granite Wash | 4 | 0 | 4 | -11 | 15 | ||||
| Haynesville | 52 | 1 | 51 | 3 | 49 | ||||
| Marcellus | 59 | 0 | 59 | 6 | 53 | ||||
| Mississippian | 2 | 0 | 2 | -3 | 5 | ||||
| Permian | 437 | -6 | 443 | -39 | 476 | ||||
| Utica | 17 | 0 | 17 | -6 | 23 | ||||
| Williston | 55 | 0 | 55 | -2 | 57 | ||||
-----
Earlier:
2019, July, 9, 16:50:00
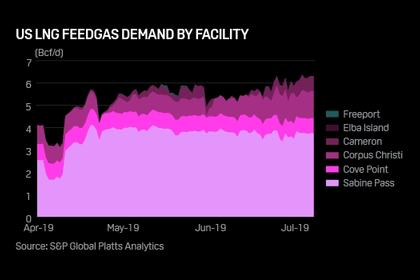
U.S. LNG DEMAND UP
Demand hit a single-day record high just below 6.4 Bcf/d on July 4 and was estimated at just under that level Monday, data compiled by S&P Global Platts Analytics shows.
2019, July, 4, 16:20:00
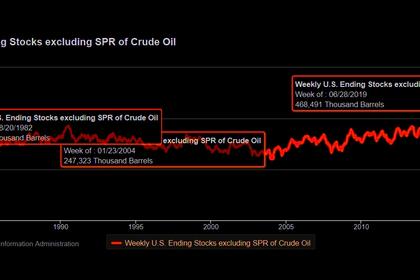
U.S. OIL INVENTORIES DOWN 1.1 MB TO 468.5 MB
US crude oil inventories for the week ended June 28, excluding the Strategic Petroleum Reserve, decreased by 1.1 million bbl from the previous week, according to data from the US Energy Information Administration.
2019, July, 4, 15:45:00
U.S. RIGS DOWN 4 TO 963
U.S. Rig Count is down 4 rigs from last week to 963, with oil rigs down 5 to 788, gas rigs up 1 to 174, and miscellaneous rigs unchanged at 1. Canada Rig Count is down 4 rigs from last week to 120, with oil rigs down 4 to 80 and gas rigs unchanged at 40.
2019, July, 2, 14:30:00
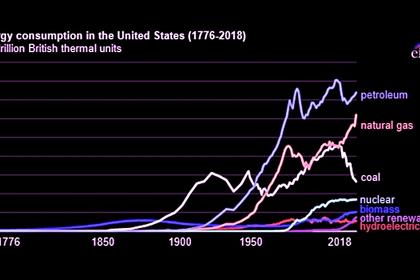
U.S. FOSSIL FUELS UP
Fossil fuels—petroleum, natural gas, and coal—have accounted for at least 80% of energy consumption in the United States for well over a century.
2019, July, 1, 11:30:00
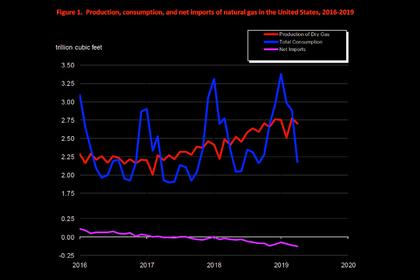
U.S. GAS PRODUCTION UP 12%
In April 2019, for the 24th consecutive month, dry natural gas production increased year to year for the month. The preliminary level for dry natural gas production in April 2019 was 2,708 billion cubic feet (Bcf), or 90.3 Bcf/d. This level was 9.8 Bcf/d (12.2%) higher than the April 2018 level of 80.4 Bcf/d.
2019, July, 1, 11:20:00
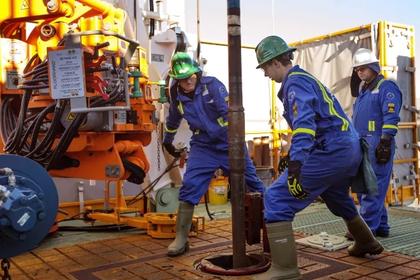
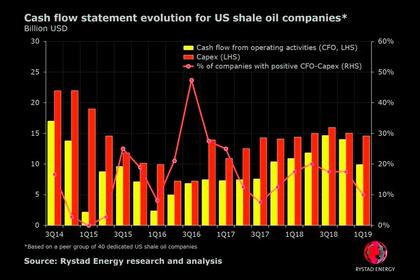
U.S. SHALE OIL PROBLEMS
Based on a study of 40 US shale oil companies, looking at cash flow from operating activities, only four companies reported a positive cash flow balance in the first quarter of 2019.
2019, July, 1, 10:55:00
U.S. RIGS UP 0 TO 967
U.S. Rig Count is unchanged from from last week at 967, with oil rigs up 4 to 793, gas rigs down 4 to 173, and miscellaneous rigs unchanged at 1. Canada Rig Count is up 5 rigs from last week to 124, with oil rigs up 4 to 84 and gas rigs up 1 to 40.


