2019-07-30 10:40:00
U.S. RIGS DOWN 8 TO 946

BHGE - U.S. Rig Count is down 8 rigs from last week to 946, with oil rigs down 3 to 776, gas rigs down 5 to 169, and miscellaneous rigs unchanged at 1.
U.S. Rig Count is down 102 rigs from last year's count of 1,048, with oil rigs down 85, gas rigs down 17, and miscellaneous rigs unchanged.
The U.S. Offshore Rig Count is down 1 rig to 25 and up 9 rigs year-over-year.
Canada Rig Count is up 9 rigs from last week to 127, with oil rigs up 2 to 85 and gas rigs up 7 to 42.
Canada Rig Count is down 96 rigs from last year's count of 223, with oil rigs down 69 and gas rigs down 27.
| Rotary Rig Count | |||||||||
| 7/26/19 | |||||||||
| Week | Year | ||||||||
| Location | Week | +/- | Ago | +/- | Ago | ||||
| Land | 921 | -5 | 926 | -109 | 1030 | ||||
| Inland Waters | 0 | -2 | 2 | -2 | 2 | ||||
| Offshore | 25 | -1 | 26 | 9 | 16 | ||||
| United States Total | 946 | -8 | 954 | -102 | 1048 | ||||
| Gulf Of Mexico | 23 | -2 | 25 | 8 | 15 | ||||
| Canada | 127 | 9 | 118 | -96 | 223 | ||||
| North America | 1073 | 1 | 1072 | -198 | 1271 | ||||
| U.S. Breakout Information | This Week | +/- | Last Week | +/- | Year Ago | ||||
| Oil | 776 | -3 | 779 | -85 | 861 | ||||
| Gas | 169 | -5 | 174 | -17 | 186 | ||||
| Miscellaneous | 1 | 0 | 1 | 0 | 1 | ||||
| Directional | 67 | -2 | 69 | 3 | 64 | ||||
| Horizontal | 823 | -6 | 829 | -99 | 922 | ||||
| Vertical | 56 | 0 | 56 | -6 | 62 | ||||
| Canada Breakout Information | This Week | +/- | Last Week | +/- | Year Ago | ||||
| Oil | 85 | 2 | 83 | -69 | 154 | ||||
| Gas | 42 | 7 | 35 | -27 | 69 | ||||
| Major State Variances | This Week | +/- | Last Week | +/- | Year Ago | ||||
| Alaska | 9 | -1 | 10 | 3 | 6 | ||||
| Arkansas | 0 | 0 | 0 | -1 | 1 | ||||
| California | 18 | 1 | 17 | 3 | 15 | ||||
| Colorado | 32 | 1 | 31 | 0 | 32 | ||||
| Kansas | 1 | 1 | 0 | 0 | 1 | ||||
| Louisiana | 62 | -4 | 66 | 10 | 52 | ||||
| New Mexico | 109 | 2 | 107 | 5 | 104 | ||||
| North Dakota | 47 | -8 | 55 | -10 | 57 | ||||
| Ohio | 15 | -2 | 17 | -7 | 22 | ||||
| Oklahoma | 93 | -2 | 95 | -44 | 137 | ||||
| Pennsylvania | 37 | 0 | 37 | -2 | 39 | ||||
| Texas | 454 | 0 | 454 | -70 | 524 | ||||
| Utah | 7 | 1 | 6 | 1 | 6 | ||||
| West Virginia | 20 | -1 | 21 | 3 | 17 | ||||
| Wyoming | 36 | 4 | 32 | 8 | 28 | ||||
| Major Basin Variances | This Week | +/- | Last Week | +/- | Year Ago | ||||
| Ardmore Woodford | 5 | 1 | 4 | 3 | 2 | ||||
| Arkoma Woodford | 3 | 1 | 2 | -4 | 7 | ||||
| Barnett | 1 | 0 | 1 | -2 | 3 | ||||
| Cana Woodford | 49 | 0 | 49 | -22 | 71 | ||||
| DJ-Niobrara | 29 | 2 | 27 | 4 | 25 | ||||
| Eagle Ford | 66 | -1 | 67 | -14 | 80 | ||||
| Granite Wash | 4 | 0 | 4 | -10 | 14 | ||||
| Haynesville | 51 | 0 | 51 | 3 | 48 | ||||
| Marcellus | 56 | -2 | 58 | 1 | 55 | ||||
| Mississippian | 2 | 0 | 2 | -3 | 5 | ||||
| Permian | 443 | 3 | 440 | -37 | 480 | ||||
| Utica | 15 | -2 | 17 | -8 | 23 | ||||
| Williston | 47 | -8 | 55 | -10 | 57 | ||||
-----
Earlier:

2019, July, 25, 20:00:00
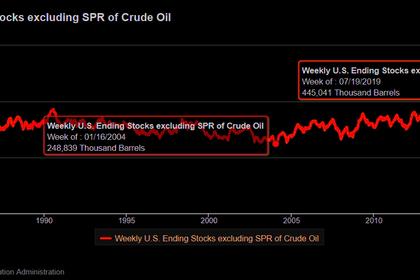
U.S. OIL INVENTORIES 445 MLN BBL
At 445 million bbl, US crude oil inventories are 2% above the 5-year average for this time of year,

2019, July, 20, 13:05:00
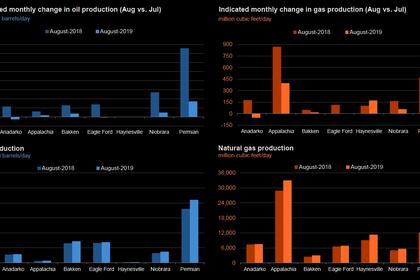
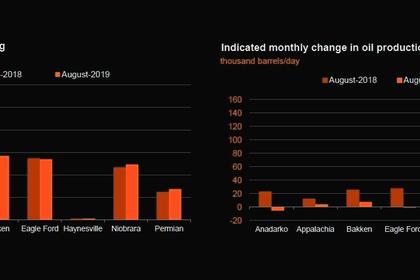
U.S. PRODUCTION: OIL + 49 TBD, GAS + 745 MCFD
U.S. EIA - Crude oil production from the major US onshore regions is forecast to increase 49,000 b/d month-over-month in July from 8,497 to 8,546 thousand barrels/day, gas production to increase 745 million cubic feet/day from 81,213 to 81,958 million cubic feet/day .

2019, July, 20, 12:55:00
U.S. OIL SERVICE DOWN
the U.S. the number of yet-to-be-fracked wells hit 8,289 in May, up 22% in a year, according to the U.S. Energy Information Administration.

2019, July, 20, 11:35:00
U.S. RIGS DOWN 4 TO 954
U.S. Rig Count is down 4 rigs from last week to 954, with oil rigs down 5 to 779, gas rigs up 2 to 174, and miscellaneous rigs down 1 to 1. Canada Rig Count is up 1 rig from last week to 118, with oil rigs down 2 to 83 and gas rigs up 3 to 35.

2019, July, 15, 12:00:00
U.S. RIGS DOWN 5 TO 958
U.S. Rig Count is down 5 rigs from last week to 958, with oil rigs down 4 to 784, gas rigs down 2 to 172, and miscellaneous rigs up 1 to 2. U.S. Rig Count is down 5 rigs from last week to 958, with oil rigs down 4 to 784, gas rigs down 2 to 172, and miscellaneous rigs up 1 to 2.

2019, July, 4, 16:20:00
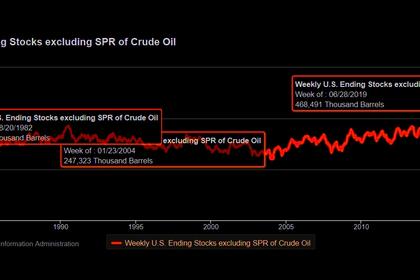
U.S. OIL INVENTORIES DOWN 1.1 MB TO 468.5 MB
US crude oil inventories for the week ended June 28, excluding the Strategic Petroleum Reserve, decreased by 1.1 million bbl from the previous week, according to data from the US Energy Information Administration.

2019, July, 4, 15:45:00
U.S. RIGS DOWN 4 TO 963
U.S. Rig Count is down 4 rigs from last week to 963, with oil rigs down 5 to 788, gas rigs up 1 to 174, and miscellaneous rigs unchanged at 1. Canada Rig Count is down 4 rigs from last week to 120, with oil rigs down 4 to 80 and gas rigs unchanged at 40.


