2019-07-01 10:55:00
U.S. RIGS UP 0 TO 967
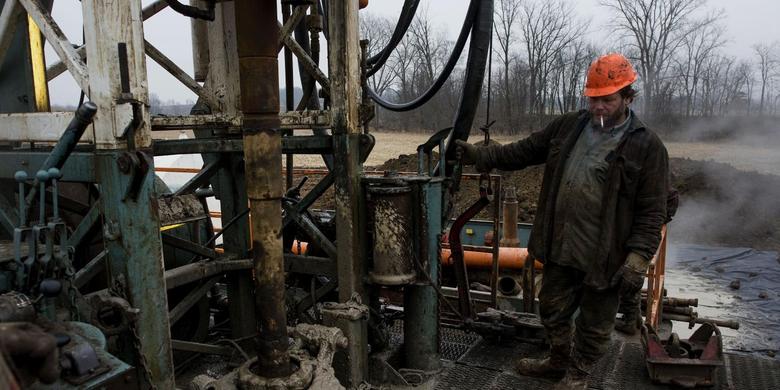
BHGE - U.S. Rig Count is unchanged from from last week at 967, with oil rigs up 4 to 793, gas rigs down 4 to 173, and miscellaneous rigs unchanged at 1.
U.S. Rig Count is down 80 rigs from last year's count of 1,047, with oil rigs down 65, gas rigs down 14, and miscellaneous rigs down 1 to 1.
The U.S. Offshore Rig Count is up 2 rigs to 26 and up 7 rigs year-over-year.
Canada Rig Count is up 5 rigs from last week to 124, with oil rigs up 4 to 84 and gas rigs up 1 to 40.
Canada Rig Count is down 48 rigs from last year's count of 172, with oil rigs down 33 and gas rigs down 15.
| Rotary Rig Count | |||||||||
| 6/28/19 | |||||||||
| Week | Year | ||||||||
| Location | Week | +/- | Ago | +/- | Ago | ||||
| Land | 938 | -1 | 939 | -86 | 1024 | ||||
| Inland Waters | 3 | -1 | 4 | -1 | 4 | ||||
| Offshore | 26 | 2 | 24 | 7 | 19 | ||||
| United States Total | 967 | 0 | 967 | -80 | 1047 | ||||
| Gulf Of Mexico | 26 | 2 | 24 | 8 | 18 | ||||
| Canada | 124 | 5 | 119 | -48 | 172 | ||||
| North America | 1091 | 5 | 1086 | -128 | 1219 | ||||
| U.S. Breakout Information | This Week | +/- | Last Week | +/- | Year Ago | ||||
| Oil | 793 | 4 | 789 | -65 | 858 | ||||
| Gas | 173 | -4 | 177 | -14 | 187 | ||||
| Miscellaneous | 1 | 0 | 1 | -1 | 2 | ||||
| Directional | 68 | 0 | 68 | 3 | 65 | ||||
| Horizontal | 840 | -6 | 846 | -86 | 926 | ||||
| Vertical | 59 | 6 | 53 | 3 | 56 | ||||
| Canada Breakout Information | This Week | +/- | Last Week | +/- | Year Ago | ||||
| Oil | 84 | 4 | 80 | -33 | 117 | ||||
| Gas | 40 | 1 | 39 | -15 | 55 | ||||
| Major State Variances | This Week | +/- | Last Week | +/- | Year Ago | ||||
| Alaska | 7 | -2 | 9 | -2 | 9 | ||||
| Arkansas | 0 | 0 | 0 | -1 | 1 | ||||
| California | 18 | 0 | 18 | 2 | 16 | ||||
| Colorado | 29 | -2 | 31 | -3 | 32 | ||||
| Louisiana | 72 | 2 | 70 | 17 | 55 | ||||
| New Mexico | 99 | -1 | 100 | 4 | 95 | ||||
| North Dakota | 55 | -1 | 56 | 1 | 54 | ||||
| Ohio | 18 | 0 | 18 | -4 | 22 | ||||
| Oklahoma | 102 | 2 | 100 | -38 | 140 | ||||
| Pennsylvania | 37 | 0 | 37 | 0 | 37 | ||||
| Texas | 464 | 1 | 463 | -66 | 530 | ||||
| Utah | 6 | 0 | 6 | -2 | 8 | ||||
| West Virginia | 21 | 0 | 21 | 4 | 17 | ||||
| Wyoming | 32 | 1 | 31 | 6 | 26 | ||||
| Major Basin Variances | This Week | +/- | Last Week | +/- | Year Ago | ||||
| Ardmore Woodford | 6 | 0 | 6 | 3 | 3 | ||||
| Arkoma Woodford | 2 | 0 | 2 | -6 | 8 | ||||
| Barnett | 1 | 0 | 1 | -3 | 4 | ||||
| Cana Woodford | 49 | 4 | 45 | -25 | 74 | ||||
| DJ-Niobrara | 26 | -2 | 28 | 0 | 26 | ||||
| Eagle Ford | 71 | -2 | 73 | -9 | 80 | ||||
| Granite Wash | 4 | -2 | 6 | -12 | 16 | ||||
| Haynesville | 53 | 0 | 53 | 3 | 50 | ||||
| Marcellus | 58 | 0 | 58 | 5 | 53 | ||||
| Mississippian | 2 | -1 | 3 | -3 | 5 | ||||
| Permian | 441 | 2 | 439 | -33 | 474 | ||||
| Utica | 17 | 0 | 17 | -6 | 23 | ||||
| Williston | 55 | -1 | 56 | 1 | 54 | ||||
-----
Earlier:
2019, June, 24, 12:15:00
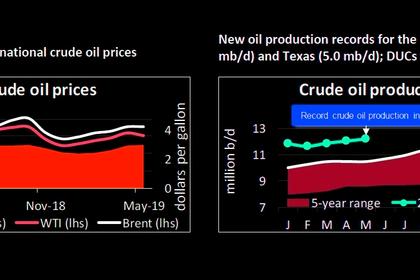
U.S. OIL PRODUCTION 12.2 MBD
U.S. crude oil production reached a new all-time high of 12.2 million barrels per day (mb/d) in May 2019
2019, June, 24, 12:10:00
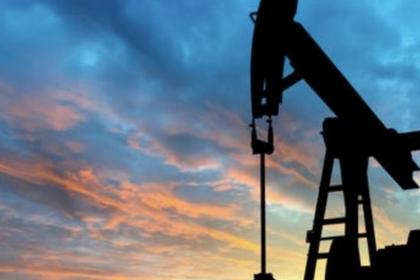
6 UNDERVALUED ENERGY STOCKS ANEW
Let’s see which companies are still undervalued and which ones are out of my radar. Some of them reached their fair value and some other stopped to satisfy my parameters.
2019, June, 24, 11:50:00
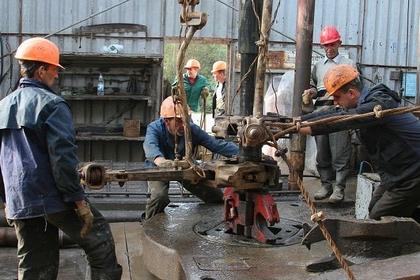
U.S. RIGS DOWN 2 TO 967
U.S. Rig Count is down 2 rigs from last week to 967, with oil rigs up 1 to 789, gas rigs down 4 to 177, and miscellaneous rigs up 1 to 1. Canada Rig Count is up 12 rigs from last week to 119, with oil rigs up 11 to 80 and gas rigs up 1 to 39.
2019, June, 18, 17:20:00
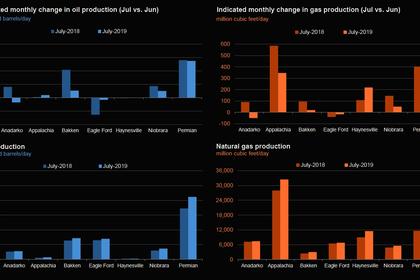
U.S. PRODUCTION: OIL + 70 TBD, GAS + 798 MCFD
U.S. EIA - Crude oil production from the major US onshore regions is forecast to increase 70,000 b/d month-over-month in June from 8,450 to 8,8,520 thousand barrels/day, gas production to increase 798 million cubic feet/day from 80,564 to 81,362 million cubic feet/day .
2019, June, 17, 12:10:00
U.S. RIGS DOWN 6 TO 969
BHGE - U.S. Rig Count is down 6 rigs from last week to 969, with oil rigs down 1 to 788, gas rigs down 5 to 181, and miscellaneous rigs unchanged at 0. Canada Rig Count is up 4 rigs from last week to 107, with oil rigs up 10 to 69 and gas rigs down 6 to 38.
2019, June, 14, 11:05:00
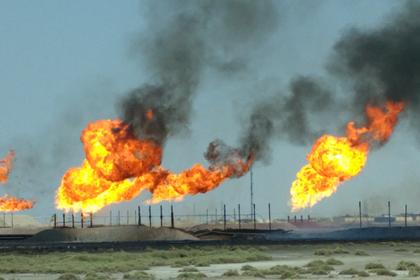
GLOBAL GAS FLARING UP 3%
Gas flaring, the burning of natural gas associated with oil extraction, takes place because of technical, regulatory, and/or economic constraints. It results in more than 350 million tons of CO2 equivalent emissions every year and wastes a valuable resource, with harmful impacts to the environment from un-combusted methane and black carbon emissions.


