2019-07-04 16:15:00
U.S. TRADE DEFICIT $55.5 BLN
U.S. BEA - U.S. International Trade in Goods and Services, May 2019
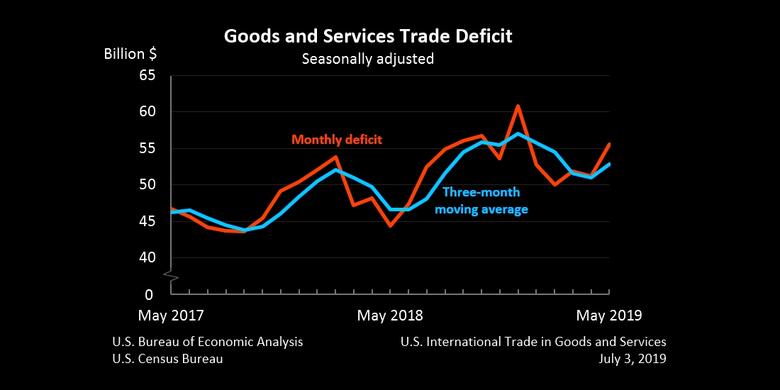
The U.S. Census Bureau and the U.S. Bureau of Economic Analysis announced today that the goods and services deficit was $55.5 billion in May, up $4.3 billion from $51.2 billion in April, revised.
| Deficit: | $55.5 Billion | +8.4%° |
| Exports: | $210.6 Billion | +2.0%° |
| Imports: | $266.2 Billion | +3.3%° |
|
Next release: August 2, 2019 (°) Statistical significance is not applicable or not measurable. Source: U.S. Census Bureau, U.S. Bureau of Economic Analysis; U.S. International Trade in Goods and Services, July 3, 2019 |
||
Exports, Imports, and Balance (exhibit 1)
May exports were $210.6 billion, $4.2 billion more than April exports. May imports were $266.2 billion, $8.5 billion more than April imports.
The May increase in the goods and services deficit reflected an increase in the goods deficit of $4.4 billion to $76.1 billion and an increase in the services surplus of $0.1 billion to $20.6 billion.
Year-to-date, the goods and services deficit increased $15.7 billion, or 6.4 percent, from the same period in 2018. Exports increased $5.1 billion or 0.5 percent. Imports increased $20.8 billion or 1.6 percent.
Three-Month Moving Averages (exhibit 2)
The average goods and services deficit increased $1.8 billion to $52.9 billion for the three months ending in May.
- Average exports increased $0.3 billion to $209.5 billion in May.
- Average imports increased $2.2 billion to $262.4 billion in May.
Year-over-year, the average goods and services deficit increased $6.3 billion from the three months ending in May 2018.
- Average exports decreased $1.2 billion from May 2018.
- Average imports increased $5.1 billion from May 2018.
Exports (exhibits 3, 6, and 7)
Exports of goods increased $3.9 billion to $140.8 billion in May.
Exports of goods on a Census basis increased $4.0 billion.
- Capital goods increased $1.4 billion.
- Civilian aircraft increased $0.5 billion.
- Telecommunications equipment increased $0.4 billion.
- Consumer goods increased $0.8 billion.
- Gem diamonds increased $0.3 billion.
- Jewelry increased $0.3 billion.
- Pharmaceutical preparations increased $0.2 billion.
- Foods, feeds, and beverages increased $0.7 billion.
- Soybeans increased $0.7 billion.
- Other goods increased $0.6 billion.
- Automotive vehicles, parts, and engines increased $0.6 billion.
Net balance of payments adjustments decreased $0.1 billion.
Exports of services increased $0.3 billion to $69.8 billion in May.
- Maintenance and repair services increased $0.1 billion.
- Travel (for all purposes including education) increased $0.1 billion.
- Transport increased $0.1 billion.
Imports (exhibits 4, 6, and 8)
Imports of goods increased $8.3 billion to $217.0 billion in May.
Imports of goods on a Census basis increased $8.1 billion.
- Automotive vehicles, parts, and engines increased $2.3 billion.
- Passenger cars increased $1.5 billion.
- Industrial supplies and materials increased $1.8 billion.
- Crude oil increased $1.3 billion.
- Capital goods increased $1.6 billion.
- Semiconductors increased $0.5 billion.
- Computers increased $0.4 billion.
- Computer accessories increased $0.3 billion.
- Consumer goods increased $1.4 billion.
- Other goods increased $1.0 billion.
Net balance of payments adjustments increased $0.2 billion.
Imports of services increased $0.2 billion to $49.2 billion in May.
- Transport increased $0.2 billion.
- Travel (for all purposes including education) decreased $0.1 billion.
Real Goods in 2012 Dollars – Census Basis (exhibit 11)
The real goods deficit increased $4.8 billion to $87.0 billion in May.
- Real exports of goods increased $4.6 billion to $150.5 billion.
- Real imports of goods increased $9.3 billion to $237.5 billion.
Revisions
Revisions to April exports
- Exports of goods were revised up less than $0.1 billion.
- Exports of services were revised down $0.4 billion.
Revisions to April imports
- Imports of goods were revised up less than $0.1 billion.
- Imports of services were revised down less than $0.1 billion.
Goods by Selected Countries and Areas: Monthly – Census Basis (exhibit 19)
The May figures show surpluses, in billions of dollars, with South and Central America ($4.1), Hong Kong ($2.6), Singapore ($0.6), Brazil ($0.5), Saudi Arabia (less than $0.1), and United Kingdom (less than $0.1). Deficits were recorded, in billions of dollars, with China ($30.1), European Union ($16.9), Mexico ($9.1), Japan ($6.0), Germany ($5.8), Canada ($3.6), Italy ($2.6), France ($2.1), India ($1.9), Taiwan ($1.5), South Korea ($1.4), and OPEC ($0.1).
- The deficit with Canada increased $1.8 billion to $3.6 billion in May. Exports decreased $0.3 billion to $24.3 billion and imports increased $1.5 billion to $27.9 billion.
- The deficit with the European Union increased $1.8 billion to $16.9 billion in May. Exports increased $0.2 billion to $27.2 billion and imports increased $2.0 billion to $44.1 billion.
- The deficit with Japan decreased $0.5 billion to $6.0 billion in May. Exports increased $0.5 billion to $6.6 billion and imports increased less than $0.1 billion to $12.5 billion.
----
Earlier:
2019, July, 3, 11:25:00
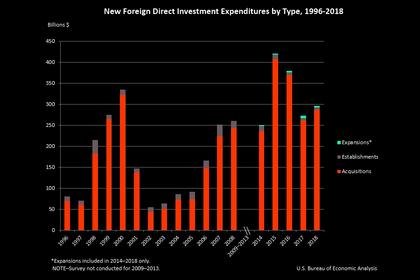
FOREIGN INVESTMENT IN U.S. UP 8.7%
Expenditures by foreign direct investors to acquire, establish, or expand U.S. businesses totaled $296.4 billion (preliminary) in 2018. Expenditures were up 8.7 percent from $272.8 billion (revised) in 2017
2019, July, 1, 11:20:00
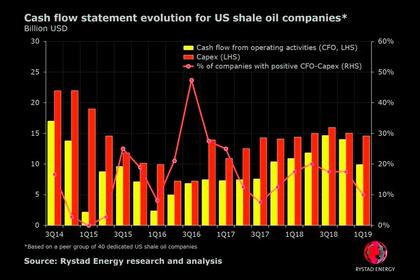
U.S. SHALE OIL PROBLEMS
Based on a study of 40 US shale oil companies, looking at cash flow from operating activities, only four companies reported a positive cash flow balance in the first quarter of 2019.
2019, June, 25, 12:50:00
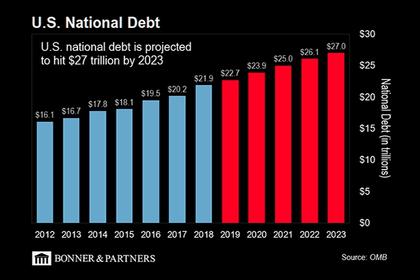
U.S. FINANCIAL RISKS UP
In addition, a number of medium-term risks are growing. The financial system appears healthy but vulnerabilities in leveraged corporates and, potentially, in the nonbank system are elevated by historical standards. An abrupt reversal of the recent supportive financial market conditions or a deepening of ongoing trade disputes represent material risks to the U.S. economy, with concomitant negative outward spillovers. The U.S. public debt-to-GDP ratio is on an unsustainable path and is expected to continue rising throughout the medium-term, as aging related spending rises.
2019, June, 21, 09:35:00
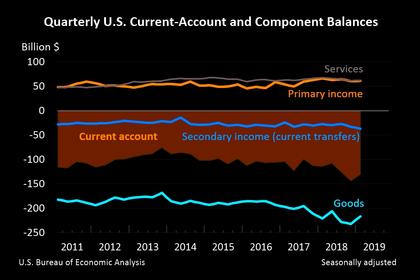
U.S. CURRENT-ACCOUNT DEFICIT DOWN TO $130.4 BLN
The U.S. current-account deficit decreased to $130.4 billion (preliminary) in the first quarter of 2019 from $143.9 billion (revised) in the fourth quarter of 2018, according to statistics released by the Bureau of Economic Analysis (BEA). The deficit was 2.5 percent of current-dollar gross domestic product in the first quarter, down from 2.8 percent in the fourth quarter.
2019, June, 18, 17:15:00
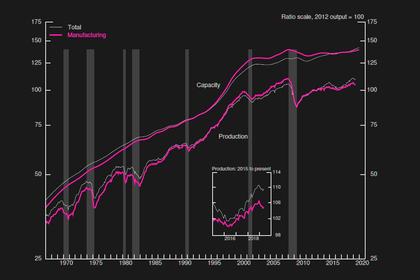
U.S. INDUSTRIAL PRODUCTION UP 0.4%
Industrial production rose 0.4 percent in May after falling 0.4 percent in April. The indexes for manufacturing and mining gained 0.2 percent and 0.1 percent, respectively, in May; the index for utilities climbed 2.1 percent. At 109.6 percent of its 2012 average, total industrial production was 2.0 percent higher in May than it was a year earlier. Capacity utilization for the industrial sector moved up 0.2 percentage point in May to 78.1 percent, a rate that is 1.7 percentage points below its long-run (1972–2018) average.


