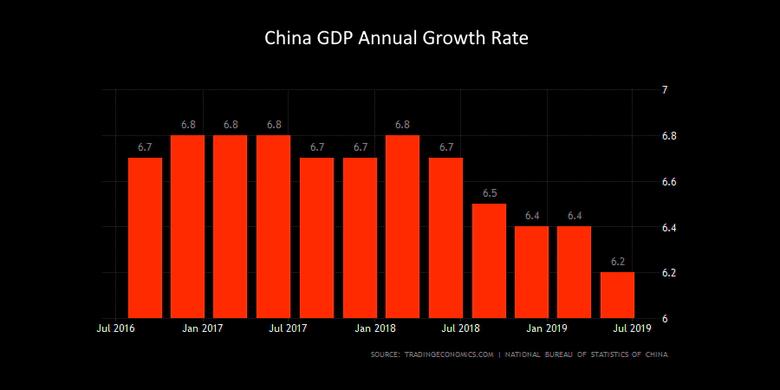
CHINA'S GDP UP 6.2%
IMF - August 9, 2019 - IMF Executive Board Concludes 2019 Article IV Consultation with the People's Republic of China
On July 31, 2019, the Executive Board of the International Monetary Fund (IMF) concluded the Article IV consultation with China.
The Chinese economy is facing external headwinds and an uncertain environment. GDP growth slowed to 6.6 percent in 2018, driven by necessary financial regulatory reforms and softening external demand. Growth is projected to moderate to 6.2 percent in 2019 as the planned policy stimulus partially offsets the negative impact from the US tariff hike on US$ 200 billion of Chinese exports. Headline inflation rose due to rising food prices and is expected to remain around 2½ percent.
Reforms progressed in several key areas. The strengthening of financial regulations and control over off-budget local government investment has reduced the pace of debt accumulation, helping contain the build-up of risks in the financial sector. Opening up continued, with decreases in tariffs, passage of a new foreign investment law, and revisions to the negative list for foreign investment entry. Progress on SOE reforms, however, was mixed.
Credit growth slowed through 2018 but began to pick up in 2019. While the corporate deleveraging partially offset government and household debt accumulation, total nonfinancial sector debt still rose faster than nominal GDP growth. The deficit of the general government sector (including estimated off-budget investment spending) was estimated to be around 11 percent of GDP in 2018.
The current account surplus fell by around 1 percentage point, to 0.4 percent of GDP in 2018 and it is projected to remain contained at 0.5 percent of GDP in 2019. The external position in 2018 was assessed to be broadly in line with the level consistent with medium-term fundamentals and desirable policies. Net capital outflows declined sharply from around $650 billion in 2015 and 2016 to $30 billion in 2018.
Executive Board Assessment
Executive Directors commended the authorities' recent reform progress, in particular, in reducing financial sector fragilities and continuing opening up of the economy. They noted the highly uncertain external environment and emphasized that successfully shifting from high-speed to high-quality growth requires continuing with deleveraging and strengthening rebalancing efforts while adjusting macroeconomic policies to respond to rising trade tensions.
Directors agreed that the announced policy measures are sufficient to stabilize growth in 2019 provided there are no further increases in tariffs, and that additional stimulus and excessive credit growth should be avoided. In this context, a few Directors reiterated the need to de-emphasize growth objectives. Directors agreed that if trade tensions escalate further, putting at risk economic and financial stability, additional stimulus, mainly fiscal, would be warranted and should be targeted.
Directors underscored the importance of structural fiscal reforms that can enhance medium-term growth.
Directors welcomed the authorities' commitment to multilateralism and a rules-based trading system. In this regard, they saw scope for China to work constructively with trading partners to better address shortcomings in the international trading system. Directors agreed that tensions between China and the United States should be quickly resolved through a comprehensive agreement that avoids undermining the international system. Directors also emphasized that China has an important role to play and would benefit from further opening up of the economy and other reforms that enhance competition.
Directors stressed the importance of staying the course on deleveraging and financial de-risking. They concurred that continuing financial regulatory reforms while strengthening bank capital, developing a clear resolution regime for banks, and containing vulnerabilities from rising household debt would help deliver a more sustainable growth path. To improve credit allocation, most Directors agreed that a plan to reduce implicit guarantees for state-owned enterprises would be important.
Directors welcomed the progress on reducing external imbalances over several years and noted staff's assessment that the external position in 2018 was broadly in line with fundamentals and desirable policies. They emphasized that achieving a durable balance in the external position requires continued progress in addressing distortions that encourage excessive household savings. In this regard, to help boost consumption and reduce inequality, Directors urged continued progress on reforms to enhance the social safety net and make the tax system more progressive. Directors concurred that greater exchange rate flexibility and deeper and better functioning FX markets would help the financial system prepare for greater capital flow volatility. Greater exchange rate policy transparency would also be important. Some Directors also called for disclosure of FX interventions. Directors agreed that China should continue to upgrade its external lending framework to foster greater coordination and cooperation, and to ensure transparency and debt sustainability.
Directors underscored that a broad set of reforms are needed to boost productivity and longer-term income convergence. They stressed the need to increase the role of the market and reduce the dominance of the public sector in many industries by ensuring fair competition, accelerating opening up to the private sector, and intensifying reform of state-owned enterprises. They also highlighted the need to continue to modernize policy frameworks, including by moving to a more price-based monetary policy framework, and addressing the misalignment of center-local fiscal responsibilities. They stressed the urgent need to address China's macroeconomic data gaps to further improve data credibility and policy making.
|
China: Selected Economic Indicators |
||||||||||||
|
2014 |
2015 |
2016 |
2017 |
2018 |
2019 |
2020 |
2021 |
2022 |
2023 |
2024 |
||
|
Projections |
||||||||||||
|
(Annual percentage change, unless otherwise indicated) |
||||||||||||
|
NATIONAL ACCOUNTS |
||||||||||||
|
Real GDP (base=2015) |
7.3 |
6.9 |
6.7 |
6.8 |
6.6 |
6.2 |
6.0 |
6.0 |
5.7 |
5.6 |
5.5 |
|
|
Total domestic demand |
7.2 |
7.2 |
7.6 |
6.3 |
7.4 |
6.1 |
6.2 |
6.2 |
6.0 |
5.8 |
5.6 |
|
|
Consumption |
7.2 |
8.3 |
8.6 |
7.4 |
9.4 |
8.0 |
7.2 |
6.6 |
6.3 |
6.2 |
6.0 |
|
|
Investment |
7.1 |
6.1 |
6.5 |
5.1 |
4.8 |
3.8 |
5.0 |
5.8 |
5.6 |
5.4 |
5.2 |
|
|
Fixed |
6.8 |
6.7 |
6.8 |
4.4 |
4.8 |
3.8 |
5.2 |
6.0 |
5.8 |
5.6 |
5.4 |
|
|
Inventories (contribution) |
0.2 |
-0.2 |
0.0 |
0.4 |
0.1 |
0.0 |
0.0 |
0.0 |
0.0 |
0.0 |
0.0 |
|
|
Net exports (contribution) |
0.4 |
-0.1 |
-0.6 |
0.6 |
-0.6 |
0.2 |
0.0 |
-0.1 |
-0.1 |
-0.1 |
-0.1 |
|
|
Total capital formation (percent of GDP) |
46.8 |
44.7 |
44.1 |
44.6 |
44.8 |
42.9 |
42.2 |
41.6 |
41.1 |
40.5 |
39.8 |
|
|
Gross national saving (percent of GDP) 1/ |
49.0 |
47.5 |
45.9 |
46.3 |
44.6 |
43.4 |
42.5 |
41.8 |
41.1 |
40.4 |
39.7 |
|
|
LABOR MARKET |
||||||||||||
|
Unemployment rate (annual average) 2/ |
5.1 |
5.1 |
5.0 |
4.9 |
4.8 |
5.0 |
... |
... |
... |
... |
... |
|
|
Employment |
0.4 |
0.3 |
0.2 |
0.0 |
-0.1 |
-0.1 |
-0.1 |
-0.1 |
0.1 |
0.1 |
0.1 |
|
|
PRICES |
||||||||||||
|
Consumer prices (average) |
2.0 |
1.4 |
2.0 |
1.6 |
2.1 |
2.2 |
2.4 |
2.8 |
2.9 |
3.0 |
3.0 |
|
|
GDP Deflator |
1.0 |
1.1 |
-0.1 |
2.4 |
2.1 |
1.4 |
1.8 |
2.1 |
2.2 |
2.4 |
2.3 |
|
|
FINANCIAL |
||||||||||||
|
7-day repo rate (percent) |
5.1 |
2.4 |
2.7 |
5.4 |
3.1 |
… |
… |
… |
… |
… |
… |
|
|
10 year government bond rate (percent) |
3.7 |
2.9 |
3.1 |
3.9 |
3.3 |
... |
... |
... |
... |
... |
... |
|
|
Real effective exchange rate (average) |
3.2 |
9.8 |
-4.9 |
-2.9 |
1.4 |
… |
… |
… |
… |
… |
… |
|
|
Nominal effective exchange rate (average) |
3.6 |
9.7 |
-5.4 |
-2.5 |
1.5 |
… |
… |
… |
… |
… |
… |
|
|
MACRO-FINANCIAL |
||||||||||||
|
Total social financing 3/ |
14.3 |
12.4 |
16.7 |
13.4 |
9.8 |
10.5 |
10.5 |
10.0 |
9.5 |
9.2 |
8.7 |
|
|
In percent of GDP |
190 |
198 |
216 |
224 |
226 |
232 |
238 |
242 |
245 |
247 |
249 |
|
|
Total nonfinancial sector debt 4/ |
17.1 |
15.4 |
19.9 |
11.0 |
10.4 |
11.6 |
11.7 |
11.0 |
10.3 |
9.9 |
8.8 |
|
|
In percent of GDP |
207 |
222 |
249 |
253 |
257 |
266 |
275 |
282 |
288 |
293 |
295 |
|
|
Domestic credit to the private sector |
13.2 |
15.8 |
21.3 |
8.5 |
7.8 |
8.8 |
9.9 |
9.5 |
8.9 |
8.7 |
8.1 |
|
|
In percent of GDP |
149 |
159 |
181 |
180 |
178 |
180 |
183 |
185 |
187 |
188 |
188 |
|
|
House price 5/ |
1.4 |
9.1 |
11.3 |
5.7 |
12.2 |
6.5 |
8.6 |
7.3 |
6.6 |
6.2 |
6.0 |
|
|
Household disposable income (percent of GDP) |
60.4 |
60.5 |
61.0 |
60.4 |
60.0 |
60.0 |
59.8 |
59.4 |
58.9 |
58.1 |
58.1 |
|
|
Household savings (percent of disposable income) |
38.0 |
37.1 |
35.5 |
35.4 |
33.0 |
31.5 |
30.3 |
28.9 |
27.3 |
25.4 |
25.0 |
|
|
Household debt (percent of GDP) |
35.8 |
38.7 |
44.8 |
49.7 |
54.0 |
56.2 |
59.1 |
61.1 |
63.2 |
65.4 |
67.9 |
|
|
Non-financial corporate domestic debt (percent of GDP) |
113 |
121 |
136 |
130 |
124 |
124 |
124 |
124 |
124 |
122 |
120 |
|
|
BIS credit-to-GDP gap (percent of GDP) 6/ |
21.1 |
20.8 |
18.2 |
10.5 |
0.4 |
... |
... |
... |
... |
... |
... |
|
|
GENERAL BUDGETARY GOVERNMENT (Percent of GDP) |
||||||||||||
|
Net lending/borrowing 7/ |
-0.9 |
-2.8 |
-3.7 |
-3.9 |
-4.8 |
-6.1 |
-5.7 |
-5.6 |
-5.6 |
-5.5 |
-5.4 |
|
|
Revenue |
28.1 |
28.5 |
28.2 |
28.3 |
29.2 |
28.8 |
29.1 |
28.8 |
28.5 |
28.2 |
28.0 |
|
|
Additional financing from land sales |
2.7 |
1.9 |
2.0 |
2.6 |
2.9 |
2.8 |
1.7 |
1.4 |
1.1 |
1.0 |
0.9 |
|
|
Expenditure |
31.6 |
33.2 |
33.9 |
34.7 |
36.9 |
37.7 |
36.5 |
35.7 |
35.2 |
34.7 |
34.3 |
|
|
Debt 8/ |
38.6 |
36.4 |
36.7 |
36.8 |
37.9 |
40.3 |
43.1 |
45.5 |
47.6 |
49.4 |
51.0 |
|
|
Structural balance |
-0.5 |
-2.5 |
-3.6 |
-3.9 |
-4.8 |
-6.1 |
-5.6 |
-5.5 |
-5.5 |
-5.4 |
-5.3 |
|
|
BALANCE OF PAYMENTS (Percent of GDP) |
||||||||||||
|
Current account balance |
2.2 |
2.7 |
1.8 |
1.6 |
0.4 |
0.5 |
0.4 |
0.2 |
0.1 |
0.0 |
-0.1 |
|
|
Trade balance |
4.1 |
5.1 |
4.4 |
3.9 |
2.9 |
3.1 |
2.9 |
2.7 |
2.5 |
2.5 |
2.4 |
|
|
Services balance |
-2.0 |
-1.9 |
-2.1 |
-2.1 |
-2.2 |
-2.2 |
-2.2 |
-2.2 |
-2.1 |
-2.1 |
-2.1 |
|
|
Net international investment position |
15.2 |
14.9 |
17.4 |
17.4 |
15.9 |
15.6 |
14.8 |
13.9 |
12.9 |
12.0 |
11.0 |
|
|
Gross official reserves (bn US$) |
3,899 |
3,406 |
3,098 |
3,236 |
3,168 |
3,167 |
3,174 |
3,177 |
3,179 |
3,182 |
3,189 |
|
|
MEMORANDUM ITEMS |
||||||||||||
|
Nominal GDP (bn RMB) 9/ |
64,718 |
69,911 |
74,563 |
81,526 |
88,702 |
95,539 |
103,084 |
111,560 |
120,546 |
130,318 |
140,613 |
|
|
Augmented debt (percent of GDP) 10/ |
52.3 |
56.6 |
62.0 |
67.3 |
72.7 |
80.2 |
86.2 |
91.1 |
95.6 |
99.3 |
101.5 |
|
|
Augmented net lending/borrowing (percent of GDP) 10/ |
-7.2 |
-8.4 |
-10.4 |
-10.8 |
-11.2 |
-12.7 |
-12.2 |
-11.9 |
-11.6 |
-11.5 |
-11.4 |
|
|
Sources: Bloomberg, CEIC, IMF International Financial Statistics database, and IMF staff estimates and projections. |
||||||||||||
|
1/ IMF staff estimates for 2017 and 2018. |
||||||||||||
|
2/ Surveyed unemployment rate. |
||||||||||||
|
3/ Not adjusted for local government debt swap. |
||||||||||||
|
4/ Includes government funds. |
||||||||||||
|
5/ Average selling prices estimated by IMF staff based on housing price data (Commodity Building Residential Price) of 70 large and mid-sized cities published by National Bureau of Statistics (NBS). |
||||||||||||
|
6/ Latest observation is for Q3 2017. |
||||||||||||
|
7/ Adjustments are made to the authorities' fiscal budgetary balances to reflect consolidated general budgetary government balance, including government-managed funds, state-administered SOE funds, adjustment to the stabilization fund, and social security fund. |
||||||||||||
|
8/ Official government debt. Estimates of debt levels before 2015 include central government debt and explicit local government debt (identified by MoF and NPC in Sep 2015). The large increase in general government debt in 2014 reflects the authorities' recognition of the off-budget local government debt borrowed previously. The estimation of debt levels after 2015 assumes zero off-budget borrowing from 2015 to 2021. |
||||||||||||
|
9/ Expenditure side nominal GDP. |
||||||||||||
|
10/ Augmented fiscal data expand the perimeter of government to include local government financing vehicles and other off-budget activity. |
||||||||||||
------
Earlier:
