2019-08-02 11:30:00
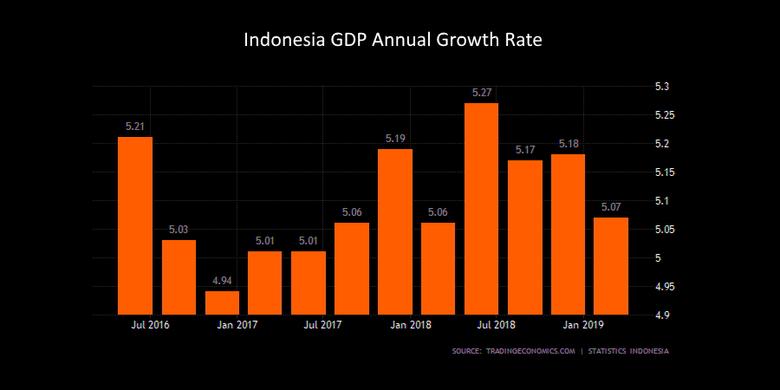
INDONESIA'S GDP UP 5.2%
IMF - July 31, 2019 - On July 3, 2019, the Executive Board of the International Monetary Fund (IMF) concluded the Article IV consultation with Indonesia.
The Indonesian economy performed well in 2018, despite external headwinds, including capital flow reversals. Growth stabilized at above 5 percent, as robust domestic demand offset a decline in net exports. The recovery of credit growth supported economic activity. Inflation eased to around 3 percent, the lower half of the official target band (3.5±1percent), as food price increases were subdued, electricity and some fuel prices were frozen, and macroeconomic policies were tightened. Core inflation is stable at 3 percent. The current account deficit widened to 2.98 percent of GDP in 2018 (1.6 percent in 2017), mainly due to lower commodity exports and higher infrastructure-related imports.
The economic outlook is positive. Real GDP growth is projected to remain stable at 5.2 percent in 2019 and 2020, and rise to the level of potential (5.3 percent) over the medium term, underpinned by robust domestic demand. Strong bank balance sheets and continued economic growth would sustain credit growth at about 12 percent. Inflation is projected to remain within the target band. The current account deficit would continue its gradual decline to 2.6 percent of GDP over the medium term. The fiscal deficit is projected to remain constant at 1.8 percent of GDP. Risks to the outlook are tilted to the downside. The main risks are external and include rising trade tensions, sharp tightening of global financial conditions, weaker-than-expected growth in China, and large swings in commodity prices, especially higher oil prices that would translate into higher current account deficit. On the upside, the start of the Administration’s second term could lead to intensified reform efforts, which would boost confidence, investment, and growth.
Executive Board Assessment
Executive Directors commended the authorities’ policy response in the face of strong external headwinds in 2018, which supported positive economic performance. While noting the favorable economic outlook, Directors encouraged the authorities to remain vigilant against risks, including from capital flow reversals, considering Indonesia’s reliance on external financing. They considered that achieving higher potential growth requires a comprehensive structural reform package, including higher domestic revenue mobilization and financial deepening, which will reduce vulnerabilities and facilitate complementary reforms in human capital, infrastructure, and labor and products markets.
Directors welcomed the appropriate focus of the near‑term policy mix on protecting macroeconomic and financial stability, safeguarding buffers, and addressing vulnerabilities. They supported maintaining a neutral fiscal stance and closely assessing macroprudential policies to ensure financial system stability. With inflation within the target band, Directors saw scope for cautious relaxation of the monetary policy stance, unless significant capital account pressures reemerge. They encouraged allowing the exchange rate to continue moving in line with market forces, with FX intervention limited to preventing disorderly market conditions.
Directors welcomed the authorities’ continued efforts to protect fiscal buffers, including with the elimination of the primary deficit in 2018, and improve the quality of spending by rebalancing expenditure toward infrastructure, education, health, and social safety nets. However, Directors noted that government revenues remain below peer countries and insufficient to finance the authorities’ development goals. In this context, they highlighted the critical need to implement a medium‑term revenue strategy, which combines well‑sequenced and prioritized tax policy and administration reforms, to finance priority spending and structural reforms, and lessen reliance on external financing. Directors also called for monitoring risks and contingent liabilities arising from state‑owned enterprises and public‑private partnerships.
Directors commended efforts to improve infrastructure, streamline regulations and reform the education and health sectors, which have contributed to improvements in the economic environment. They encouraged the authorities to expand these efforts and to address remaining structural impediments to higher growth, including by strengthening governance and the business environment. Priority actions also include improving human capital, increasing female labor participation, easing restrictions to foreign direct investment, and streamlining labor and product market regulations.
Directors welcomed the progress in strengthening the frameworks for financial oversight and crisis management in recent years, in line with FSAP recommendations. Going forward, they encouraged the authorities to focus on the areas identified by the FSAP where further improvement is needed, including clarifying institutional mandates, improving supervision of nonbank financial institutions and financial conglomerates, strengthening the legal framework for financial oversight and crisis management, and enhancing crisis management frameworks. Continued strengthening of the AML/CFT regime was also encouraged.
|
Indonesia: Selected Economic Indicators, 2014–2020 |
||||||||||||||
|
2014 |
2015 |
2016 |
2017 |
2018 |
2019 |
2020 |
||||||||
|
Proj. |
Proj. |
|||||||||||||
|
Real GDP (percent change) |
5.0 |
4.9 |
5.0 |
5.1 |
5.2 |
5.2 |
5.2 |
|||||||
|
Domestic demand |
5.0 |
4.2 |
4.6 |
5.0 |
6.3 |
5.4 |
5.2 |
|||||||
|
Of which: |
||||||||||||||
|
Private consumption 1/ |
5.3 |
4.8 |
5.0 |
5.0 |
5.1 |
5.1 |
5.1 |
|||||||
|
Government consumption |
1.2 |
5.3 |
-0.1 |
2.1 |
4.8 |
4.5 |
4.5 |
|||||||
|
Gross fixed investment |
4.4 |
5.0 |
4.5 |
6.2 |
6.7 |
6.2 |
5.9 |
|||||||
|
Change in stocks 2/ |
0.5 |
-0.6 |
0.2 |
-0.1 |
0.7 |
0.0 |
0.0 |
|||||||
|
Net exports 2/ |
-0.2 |
0.9 |
0.1 |
0.3 |
-1.0 |
-0.1 |
0.0 |
|||||||
|
Saving and investment (in percent of GDP) |
||||||||||||||
|
Gross investment 3/ |
34.6 |
34.1 |
33.9 |
33.7 |
34.5 |
34.7 |
34.9 |
|||||||
|
Gross national saving |
31.5 |
32.0 |
32.0 |
32.1 |
31.4 |
31.8 |
32.0 |
|||||||
|
Prices (12-month percent change) |
||||||||||||||
|
Consumer prices (end period) |
8.4 |
3.4 |
3.0 |
3.6 |
3.1 |
3.1 |
3.1 |
|||||||
|
Consumer prices (period average) |
6.4 |
6.4 |
3.5 |
3.8 |
3.2 |
3.1 |
3.1 |
|||||||
|
Public finances (in percent of GDP) |
||||||||||||||
|
General government revenue |
16.5 |
14.9 |
14.3 |
14.1 |
14.9 |
14.8 |
14.9 |
|||||||
|
General government expenditure |
18.6 |
17.5 |
16.8 |
16.6 |
16.6 |
16.7 |
16.7 |
|||||||
|
Of which : Energy subsidies |
3.2 |
1.0 |
0.9 |
0.7 |
1.0 |
1.0 |
1.0 |
|||||||
|
General government balance |
-2.1 |
-2.6 |
-2.5 |
-2.5 |
-1.8 |
-1.8 |
-1.8 |
|||||||
|
Primary balance |
-0.9 |
-1.2 |
-1.0 |
-0.9 |
0.0 |
-0.1 |
-0.1 |
|||||||
|
General government debt |
24.7 |
27.0 |
28.0 |
29.4 |
30.1 |
30.2 |
29.9 |
|||||||
|
Money and credit (12-month percent change; end of period) |
||||||||||||||
|
Rupiah M2 |
13.3 |
9.2 |
11.7 |
9.6 |
5.8 |
… |
… |
|||||||
|
Base money |
11.6 |
3.0 |
4.6 |
9.7 |
-1.5 |
… |
… |
|||||||
|
Private Sector Credit |
11.8 |
10.3 |
7.7 |
8.7 |
12.0 |
12.3 |
12.4 |
|||||||
|
One-month interbank rate (period average) |
7.5 |
7.1 |
6.5 |
5.6 |
6.2 |
… |
… |
|||||||
|
Balance of payments (in billions of U.S. dollars, unless otherwise indicated) |
||||||||||||||
|
Current account balance |
-27.5 |
-17.5 |
-17.0 |
-16.2 |
-31.1 |
-32.4 |
-34.7 |
|||||||
|
In percent of GDP |
-3.1 |
-2.0 |
-1.8 |
-1.6 |
-3.0 |
-2.9 |
-2.9 |
|||||||
|
Trade balance |
7.0 |
14.0 |
15.3 |
18.8 |
-0.4 |
-4.6 |
-0.6 |
|||||||
|
Of which : Oil and gas (net) |
-11.8 |
-5.7 |
-4.8 |
-7.3 |
-11.6 |
-16.2 |
-17.0 |
|||||||
|
Inward direct investment |
21.8 |
16.6 |
3.9 |
20.6 |
22.0 |
23.7 |
27.0 |
|||||||
|
Overall balance |
15.2 |
-1.1 |
12.1 |
11.6 |
-7.1 |
1.2 |
2.8 |
|||||||
|
Terms of trade, percent change (excluding oil) |
1.4 |
-1.8 |
0.4 |
1.3 |
1.1 |
-0.6 |
-0.1 |
|||||||
|
Gross reserves |
||||||||||||||
|
In billions of U.S. dollars (end period) |
111.9 |
105.9 |
116.4 |
130.2 |
120.7 |
121.9 |
124.7 |
|||||||
|
In months of prospective imports of goods and services |
8.1 |
8.0 |
7.6 |
7.2 |
6.4 |
6.0 |
5.7 |
|||||||
|
As a percent of short-term debt 4/ |
189 |
191 |
213 |
237 |
203 |
185 |
171 |
|||||||
|
Total external debt 5/ |
||||||||||||||
|
In billions of U.S. dollars |
293.3 |
310.7 |
320.0 |
352.5 |
376.8 |
415.0 |
455.2 |
|||||||
|
In percent of GDP |
32.9 |
36.1 |
34.3 |
34.7 |
36.9 |
37.7 |
37.7 |
|||||||
|
Exchange rate |
||||||||||||||
|
Rupiah per U.S. dollar (period average) |
11,862 |
13,391 |
13,306 |
13,383 |
14,231 |
… |
… |
|||||||
|
Rupiah per U.S. dollar (end of period) |
12,435 |
13,788 |
13,473 |
13,568 |
14,390 |
… |
… |
|||||||
|
Memorandum items: |
||||||||||||||
|
Jakarta Stock Exchange (12-month percentage change, composite index) |
22.3 |
-12.1 |
15.3 |
20.0 |
-2.5 |
… |
… |
|||||||
|
Oil production (thousands of barrels per day) |
794 |
800 |
820 |
815 |
800 |
740 |
710 |
|||||||
|
Nominal GDP (in trillions of rupiah) |
10,570 |
11,526 |
12,402 |
13,587 |
14,826 |
16,047 |
17,409 |
|||||||
|
Sources: Data provided by the Indonesian authorities; and IMF staff estimates and projections. |
||||||||||||||
|
1/ Includes NPISH consumption. |
||||||||||||||
|
2/ Contribution to GDP growth (percentage points). |
||||||||||||||
|
3/ Includes changes in stocks. |
||||||||||||||
|
4/ Short-term debt on a remaining maturity basis. |
||||||||||||||
|
5/ Public and private external debt. |
||||||||||||||
-----
Earlier:
2019, July, 30, 10:50:00
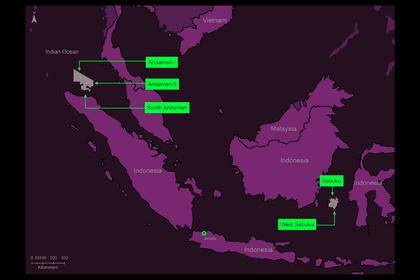
MUBADALA PETROLEUM, PREMIER OIL 20%
Mubadala Petroleum has signed an agreement with Premier Oil to farmout a 20% participating interest in each of the Andaman I and South Andaman Gross Split Production Sharing Contracts (PSCs), in which Mubadala Petroleum is the operator.
2019, July, 25, 20:05:00
ADNOC, PERTAMINA AGREEMENT $2.5 BLN
ADNOC has signed an agreement with Indonesia's state energy company Pertamina to collaborate in both countries and internationally. Indonesia' foreign ministry said that the partnership could be worth up to $2.5bn.


