U.S. OIL INVENTORIES 427.8 MLN BBL
РЕЙТЕР -
-----
Раньше:

2018, March, 14, 11:45:00
REUTERS - U.S. West Texas Intermediate (WTI) crude futures CLc1 were at $60.77 a barrel at 0753 GMT, up 6 cents, or 0.1 percent, from their previous settlement. Brent crude futures LCOc1 were at $64.62 per barrel, down just 2 cents from their last close.
|

2018, March, 7, 15:00:00
РЕЙТЕР - К 9.17 МСК фьючерсы на североморскую смесь Brent опустились на 0,85 процента до $65,23 за баррель. Фьючерсные контракты на американскую лёгкую нефть WTI к этому времени торговались у отметки $62,07 за баррель, что на 0,85 процента ниже предыдущего закрытия.
|

2018, March, 7, 14:00:00
EIA - North Sea Brent crude oil spot prices averaged $65 per barrel (b) in February, a decrease of $4/b from the January level and the first month-over-month average decrease since June 2017. EIA forecasts Brent spot prices will average about $62/b in both 2018 and 2019 compared with an average of $54/b in 2017.
|

2018, March, 5, 11:35:00
РЕЙТЕР - К 9.28 МСК фьючерсы на североморскую смесь Brent поднялись на 0,33 процента до $64,58 за баррель. Фьючерсные контракты на американскую лёгкую нефть WTI к этому времени торговались у отметки $61,44 за баррель, что на 0,31 процента выше предыдущего закрытия.
|

2018, March, 4, 11:30:00
МИНФИН РОССИИ - Средняя цена нефти марки Urals по итогам января – февраля 2018 года составила $ 65,99 за баррель.
|

2018, February, 27, 14:15:00
РЕЙТЕР - К 9.18 МСК фьючерсы на североморскую смесь Brent опустились на 0,15 процента до $67,40 за баррель. Фьючерсные контракты на американскую лёгкую нефть WTI к этому времени торговались у отметки $63,80 за баррель, что на 0,17 процента ниже предыдущего закрытия.
|

2018, February, 27, 14:05:00
МИНФИН РОССИИ - Средняя цена на нефть Urals за период мониторинга с 15 января по 14 февраля 2018 года составила $66,26457 за баррель, или $483,7 за тонну.
|
U.S. OIL INVENTORIES 427.8 MLN BBL

U.S. EIA - Summary of Weekly Petroleum Data for the week ending August 23, 2019
U.S. crude oil refinery inputs averaged 17.4 million barrels per day during the week ending August 23, 2019, which was 295,000 barrels per day less than the previous week's average. Refineries operated at 95.2% of their operable capacity last week. Gasoline production increased last week, averaging 10.7 million barrels per day. Distillate fuel production decreased last week, averaging 5.2 million barrels per day.
U.S. crude oil imports averaged 5.9 million barrels per day last week, down by 1,290,000 barrels per day from the previous week. Over the past four weeks, crude oil imports averaged about 7.0 million barrels per day, 12.3% less than the same four-week period last year. Total motor gasoline imports (including both finished gasoline and gasoline blending components) last week averaged 965,000 barrels per day, and distillate fuel imports averaged 125,000 barrels per day.
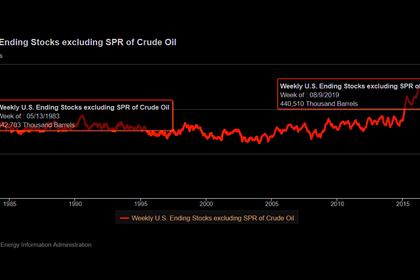
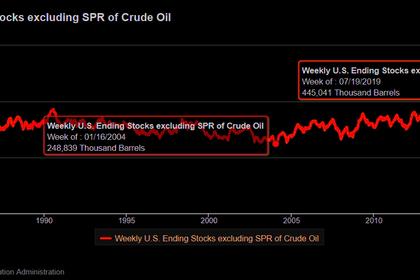
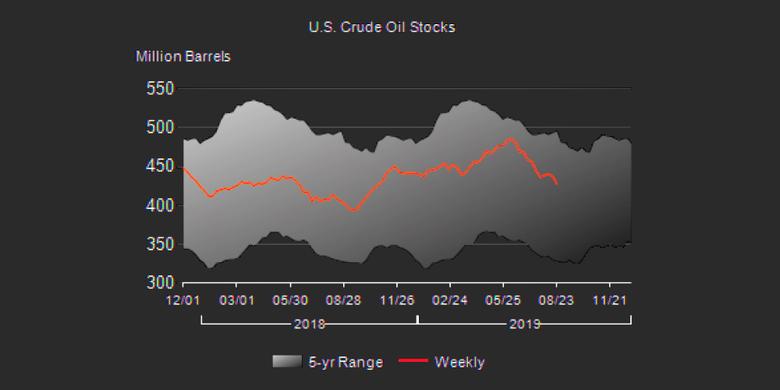
U.S. commercial crude oil inventories (excluding those in the Strategic Petroleum Reserve) decreased by 10.0 million barrels from the previous week. At 427.8 million barrels, U.S. crude oil inventories are at the five year average for this time of year. Total motor gasoline inventories decreased by 2.1 million barrels last week and are about 3% above the five year average for this time of year. Finished gasoline inventories increased while blending components inventories decreased last week. Distillate fuel inventories decreased by 2.1 million barrels last week and are about 4% below the five year average for this time of year. Propane/propylene inventories increased by 3.7 million barrels last week and are about 14% above the five year average for this time of year. Total commercial petroleum inventories decreased last week by 11.2 million barrels last week.
Total products supplied over the last four-week period averaged 21.7 million barrels per day, up by 2.3% from the same period last year. Over the past four weeks, motor gasoline product supplied averaged 9.8 million barrels per day, up by 2.4% from the same period last year. Distillate fuel product supplied averaged 3.9 million barrels per day over the past four weeks, down by 5.5% from the same period last year. Jet fuel product supplied was down 1.2% compared with the same four-week period last year.
Full PDF version
-----
Earlier:
2019, August, 26, 15:00:00
U.S. RIGS DOWN 19 TO 916
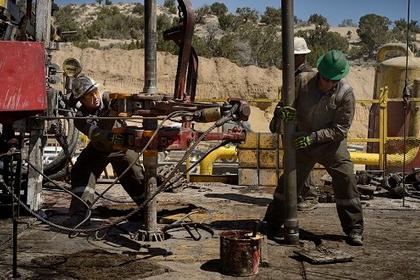
U.S. Rig Count is down 19 rigs from last week to 916, with oil rigs down 16 to 754, gas rigs down 3 to 162, and miscellaneous rigs unchanged at 0. U.S. Rig Count is down 19 rigs from last week to 916, with oil rigs down 16 to 754, gas rigs down 3 to 162, and miscellaneous rigs unchanged at 0.
2019, August, 21, 12:30:00
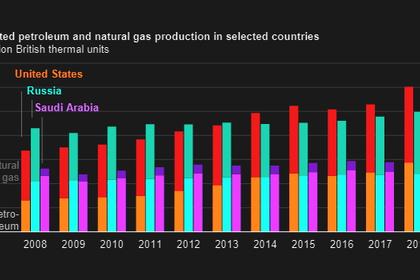
U.S. OIL, GAS PRODUCTION UP
U.S. petroleum and natural gas production increased by 16% and by 12%, respectively, in 2018, and these totals combined established a new production record.
2019, August, 19, 11:40:00
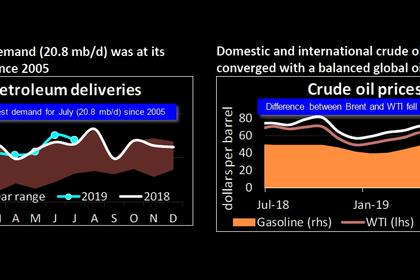
U.S. PETROLEUM DEMAND 20.8 MBD
Total U.S. petroleum demand averaged 20.8 million barrels per day (mb/d) in July 2019, which represented a 0.9% year-over-year increase and the highest demand for the month since 2005,
2019, August, 13, 13:25:00
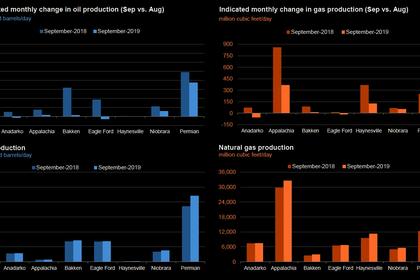
U.S. PRODUCTION: OIL + 85 TBD, GAS + 729 MCFD
U.S. EIA - Crude oil production from the major US onshore regions is forecast to increase 85,000 b/d month-over-month in August from 8,683 to 8,768 thousand barrels/day, gas production to increase 729 million cubic feet/day from 80,866 to 81,595 million cubic feet/day .
All Publications »
Tags:
USA,
OIL,
INVENTORIES


