2019-08-13 13:25:00
U.S. PRODUCTION: OIL + 85 TBD, GAS + 729 MCFD
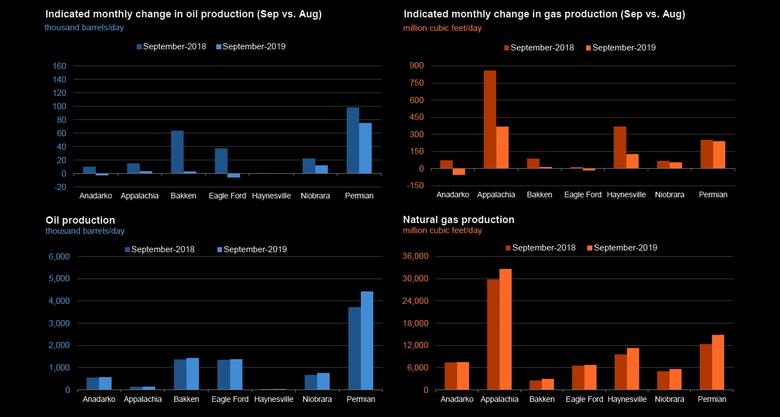
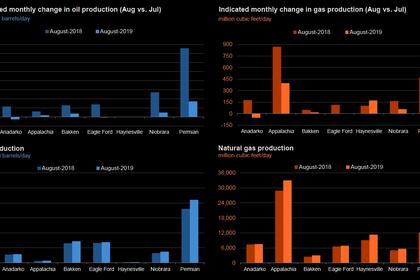
U.S. EIA - Crude oil production from the major US onshore regions is forecast to increase 85,000 b/d month-over-month in August from 8,683 to 8,768 thousand barrels/day, gas production to increase 729 million cubic feet/day from 80,866 to 81,595 million cubic feet/day .
| Oil production thousand barrels/day | Gas production million cubic feet/day | |||||
|---|---|---|---|---|---|---|
| Region | August 2019 | September 2019 | change | August 2019 | September 2019 | change |
| Anadarko | 582 | 579 | (3) | 7,563 | 7,508 | (55) |
| Appalachia | 142 | 146 | 4 | 32,238 | 32,605 | 367 |
| Bakken | 1,433 | 1,436 | 3 | 2,942 | 2,954 | 12 |
| Eagle Ford | 1,389 | 1,383 | (6) | 6,748 | 6,732 | (16) |
| Haynesville | 43 | 43 | - | 11,189 | 11,316 | 127 |
| Niobrara | 746 | 758 | 12 | 5,566 | 5,620 | 54 |
| Permian | 4,348 | 4,423 | 75 | 14,620 | 14,860 | 240 |
| Total | 8,683 | 8,768 | 85 | 80,866 | 81,595 | 729 |
| New-well oil production per rig barrels/day | New-well gas production per rig thousand cubic feet/day | |||||
|---|---|---|---|---|---|---|
| Region | August 2019 | September 2019 | change | August 2019 | September 2019 | change |
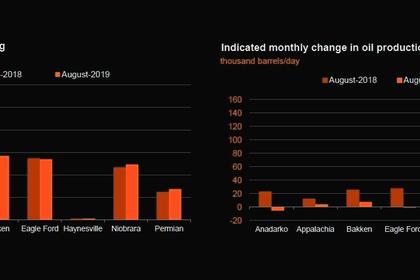
| Anadarko | 471 | 481 | 10 | 2,951 | 2,968 | 17 |
| Appalachia | 147 | 149 | 2 | 18,213 | 18,238 | 25 |
| Bakken | 1,425 | 1,437 | 12 | 2,092 | 2,138 | 46 |
| Eagle Ford | 1,361 | 1,366 | 5 | 4,864 | 4,882 | 18 |
| Haynesville | 26 | 26 | - | 10,122 | 10,128 | 6 |
| Niobrara | 1,231 | 1,234 | 3 | 4,280 | 4,293 | 13 |
| Permian | 684 | 768 | 84 | 1,244 | 1,426 | 182 |
| Rig-weighted average | 720 | 767 | 47 | 4,104 | 4,175 | 71 |
| Drilled but uncompleted wells (DUC) | |||
| wells | |||
| Region | June 2019 | July 2019 | change |
| Anadarko | 936 | 904 | -32 |
| Appalachia | 438 | 422 | -16 |
| Bakken | 693 | 675 | -18 |
| Eagle Ford | 1,517 | 1,504 | -13 |
| Haynesville | 189 | 182 | -7 |
| Niobrara | 445 | 422 | -23 |
| Permian | 3,99 | 3,999 | 9 |
| Total | 8,208 | 8,108 | -100 |
-----
Earlier:
2019, August, 12, 13:20:00
U.S. GAS DEMAND UP
U.S. natural gas demand is rising as power generators shut coal plants and burn more gas for electricity and as rapidly expanding liquefied natural gas (LNG) terminals turn more of the fuel into super-cooled liquid for export.
2019, August, 12, 13:15:00
U.S. GAS SALES UP
Russian gas sales on Gazprom Export's Electronic Sales Platform (ESP) rebounded above 100 million cu m in Thursday's auction, continuing a trend of steady strong sales on the platform this month.

2019, August, 12, 12:40:00
U.S. RIGS DOWN 8 TO 934
U.S. Rig Count is down 8 rigs from last week to 934, with oil rigs down 6 to 764, gas rigs down 2 to 169, and miscellaneous rigs unchanged at 1. Canada Rig Count is up 3 rigs from last week to 140, with oil rigs up 3 to 94 and gas rigs unchanged at 46.
2019, July, 30, 11:55:00
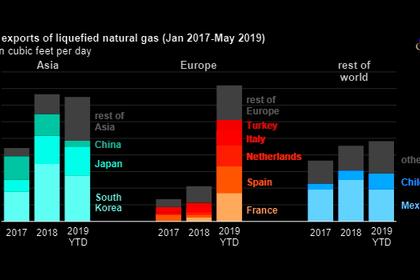
U.S. LNG FOR EUROPE UP
U.S. exports of liquefied natural gas (LNG) have been growing steadily and reached a new peak of 4.7 billion cubic feet per day (Bcf/d) in May 2019,
2019, July, 25, 20:00:00
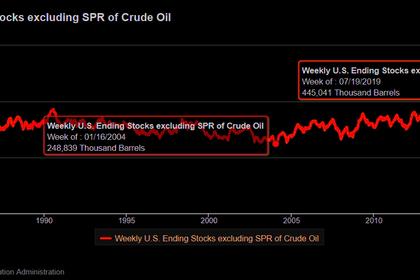
U.S. OIL INVENTORIES 445 MLN BBL
At 445 million bbl, US crude oil inventories are 2% above the 5-year average for this time of year,
2019, July, 20, 13:05:00
U.S. PRODUCTION: OIL + 49 TBD, GAS + 745 MCFD
U.S. EIA - Crude oil production from the major US onshore regions is forecast to increase 49,000 b/d month-over-month in July from 8,497 to 8,546 thousand barrels/day, gas production to increase 745 million cubic feet/day from 81,213 to 81,958 million cubic feet/day .
2019, July, 20, 12:55:00
U.S. OIL SERVICE DOWN
the U.S. the number of yet-to-be-fracked wells hit 8,289 in May, up 22% in a year, according to the U.S. Energy Information Administration.


