2019-08-26 15:00:00
U.S. RIGS DOWN 19 TO 916
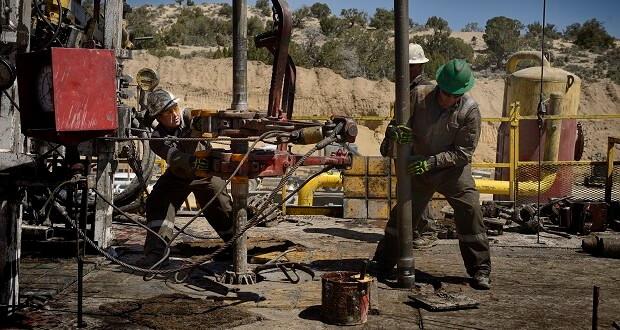
BHGE - U.S. Rig Count is down 19 rigs from last week to 916, with oil rigs down 16 to 754, gas rigs down 3 to 162, and miscellaneous rigs unchanged at 0.
U.S. Rig Count is down 128 rigs from last year's count of 1,044, with oil rigs down 106, gas rigs down 20, and miscellaneous rigs down 2.
The U.S. Offshore Rig Count is up 1 rig to 28 and up 10 rigs year-over-year.
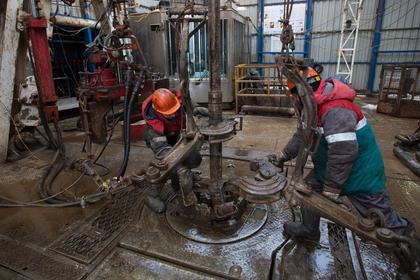
Canada Rig Count is down 3 rigs from last week to 139, with oil rigs down 6 to 95 and gas rigs up 3 to 44.
Canada Rig Count is down 90 rigs from last year's count of 229, with oil rigs down 58 and gas rigs down 32.
| Rotary Rig Count | |||||||||
| 8/23/19 | |||||||||
| Week | Year | ||||||||
| Location | Week | +/- | Ago | +/- | Ago | ||||
| Land | 887 | -20 | 907 | -138 | 1025 | ||||
| Inland Waters | 1 | 0 | 1 | 0 | 1 | ||||
| Offshore | 28 | 1 | 27 | 10 | 18 | ||||
| United States Total | 916 | -19 | 935 | -128 | 1044 | ||||
| Gulf Of Mexico | 26 | 1 | 25 | 10 | 16 | ||||
| Canada | 139 | -3 | 142 | -90 | 229 | ||||
| North America | 1055 | -22 | 1077 | -218 | 1273 | ||||
| U.S. Breakout Information | This Week | +/- | Last Week | +/- | Year Ago | ||||
| Oil | 754 | -16 | 770 | -106 | 860 | ||||
| Gas | 162 | -3 | 165 | -20 | 182 | ||||
| Miscellaneous | 0 | 0 | 0 | -2 | 2 | ||||
| Directional | 69 | 1 | 68 | 7 | 62 | ||||
| Horizontal | 797 | -18 | 815 | -122 | 919 | ||||
| Vertical | 50 | -2 | 52 | -13 | 63 | ||||
| Canada Breakout Information | This Week | +/- | Last Week | +/- | Year Ago | ||||
| Oil | 95 | -6 | 101 | -58 | 153 | ||||
| Gas | 44 | 3 | 41 | -32 | 76 | ||||
| Major State Variances | This Week | +/- | Last Week | +/- | Year Ago | ||||
| Alaska | 8 | -2 | 10 | 3 | 5 | ||||
| California | 18 | 0 | 18 | 3 | 15 | ||||
| Colorado | 28 | -4 | 32 | -2 | 30 | ||||
| Kansas | 1 | 1 | 0 | 1 | 0 | ||||
| Louisiana | 61 | -1 | 62 | 7 | 54 | ||||
| New Mexico | 109 | -2 | 111 | 6 | 103 | ||||
| North Dakota | 48 | 0 | 48 | -4 | 52 | ||||
| Ohio | 12 | 0 | 12 | -9 | 21 | ||||
| Oklahoma | 82 | -3 | 85 | -58 | 140 | ||||
| Pennsylvania | 35 | -6 | 41 | -5 | 40 | ||||
| Texas | 446 | -4 | 450 | -82 | 528 | ||||
| Utah | 7 | 0 | 7 | 1 | 6 | ||||
| West Virginia | 19 | 3 | 16 | 6 | 13 | ||||
| Wyoming | 37 | 0 | 37 | 8 | 29 | ||||
| Major Basin Variances | This Week | +/- | Last Week | +/- | Year Ago | ||||
| Ardmore Woodford | 4 | -1 | 5 | 2 | 2 | ||||
| Arkoma Woodford | 3 | 0 | 3 | -4 | 7 | ||||
| Barnett | 1 | 0 | 1 | -1 | 2 | ||||
| Cana Woodford | 45 | -1 | 46 | -20 | 65 | ||||
| DJ-Niobrara | 25 | -5 | 30 | 1 | 24 | ||||
| Eagle Ford | 67 | 0 | 67 | -12 | 79 | ||||
| Granite Wash | 4 | 0 | 4 | -11 | 15 | ||||
| Haynesville | 50 | 0 | 50 | 1 | 49 | ||||
| Marcellus | 53 | -3 | 56 | 1 | 52 | ||||
| Mississippian | 3 | 1 | 2 | -1 | 4 | ||||
| Permian | 434 | -7 | 441 | -51 | 485 | ||||
| Utica | 13 | 0 | 13 | -9 | 22 | ||||
| Williston | 48 | 0 | 48 | -4 | 52 | ||||
-----
Earlier:
2019, August, 23, 11:05:00
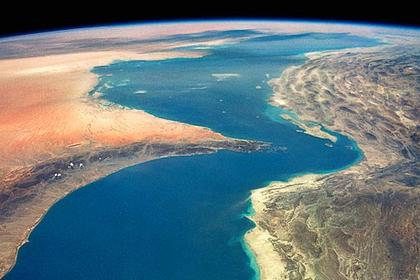
U.S., UK, AUSTRALIA CAN CLOSE HORMUZ
Foremost among the areas to be patrolled is the Strait of Hormuz, between Oman and Iran, through which about one-fifth of the world’s seaborne crude flows out of the Gulf.

2019, August, 23, 10:25:00
U.S. WANT VIETNAM OIL AND GAS
U.S. energy firms had interests in the South China Sea and Washington was “committed to bolstering the energy security of our partners and allies in the Indo-Pacific region and in ensuring uninterrupted regional oil and gas production for the global market.”U.S. warships have conducted periodic “freedom of navigation” operations in the South China Sea to challenge China’s claim to nearly all of the strategic waterway.
2019, August, 19, 11:15:00
U.S. RIGS UP 1 TO 935
U.S. Rig Count is up 1 rig from last week to 935, with oil rigs up 6 to 770, gas rigs down 4 to 165, and miscellaneous rigs down 1 to 0. Canada Rig Count is up 2 rigs from last week to 142, with oil rigs up 7 to 101 and gas rigs down 5 to 41.

2019, August, 16, 10:35:00
U.S., RUSSIA SANCTIONS AGAIN
The US is set to impose sanctions on Rosneft if it continues to trade crude oil and fuel with Venezuela's PDVSA in exchange for debt repayments and stakes in joint venture projects in the South American nation,
2019, August, 16, 10:25:00
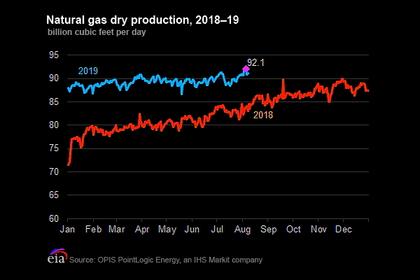
U.S. GAS PRODUCTION UP
U.S. natural gas production continued to increase in August despite relatively low natural gas spot prices
2019, August, 16, 10:20:00
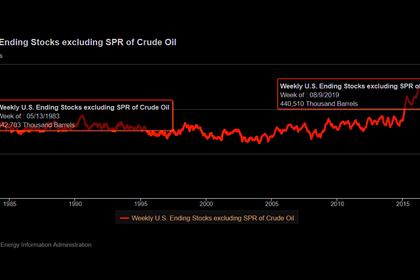
U.S. OIL INVENTORIES 440.5 MLN BBL
At 440.5 million bbl, US crude oil inventories are 3% above the 5-year average for this time of year
2019, August, 13, 13:25:00
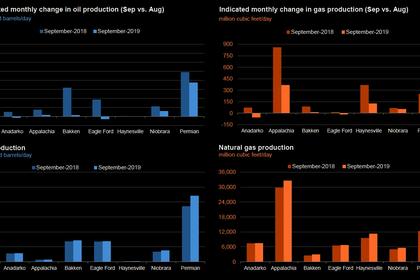
U.S. PRODUCTION: OIL + 85 TBD, GAS + 729 MCFD
U.S. EIA - Crude oil production from the major US onshore regions is forecast to increase 85,000 b/d month-over-month in August from 8,683 to 8,768 thousand barrels/day, gas production to increase 729 million cubic feet/day from 80,866 to 81,595 million cubic feet/day .


