2019-08-05 13:25:00
U.S. TRADE DEFICIT $55.2 BLN
U.S. BEA - U.S. International Trade in Goods and Services, June 2019
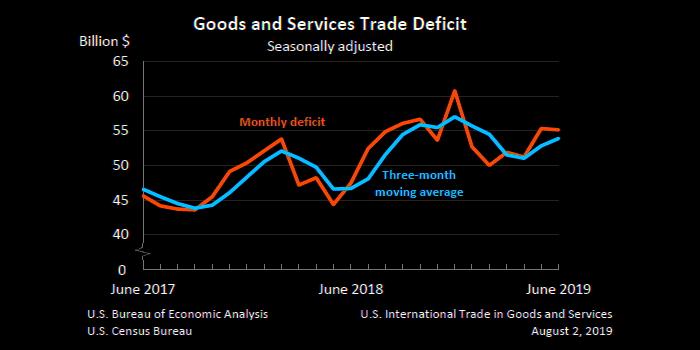
The U.S. Census Bureau and the U.S. Bureau of Economic Analysis announced today that the goods and services deficit was $55.2 billion in June, down $0.2 billion from $55.3 billion in May, revised.
| Deficit: | $55.2 Billion | -0.3%° |
| Exports: | $206.3 Billion | -2.1%° |
| Imports: | $261.5 Billion | -1.7%° |
|
Next release: September 4, 2019 (°) Statistical significance is not applicable or not measurable. Data adjusted for seasonality but not price changes Source: U.S. Census Bureau, U.S. Bureau of Economic Analysis; U.S. International Trade in Goods and Services, August 2, 2019 |
||
Exports, Imports, and Balance (exhibit 1)
June exports were $206.3 billion, $4.4 billion less than May exports. June imports were $261.5 billion, $4.6 billion less than May imports.
The June decrease in the goods and services deficit reflected a decrease in the goods deficit of $0.8 billion to $75.1 billion and a decrease in the services surplus of $0.6 billion to $20.0 billion.
Year-to-date, the goods and services deficit increased $23.2 billion, or 7.9 percent, from the same period in 2018. Exports increased $0.5 billion or less than 0.1 percent. Imports increased $23.8 billion or 1.5 percent.
Three-Month Moving Averages (exhibit 2)
The average goods and services deficit increased $1.1 billion to $53.9 billion for the three months ending in June.
- Average exports decreased $1.7 billion to $207.8 billion in June.
- Average imports decreased $0.6 billion to $261.7 billion in June.
Year-over-year, the average goods and services deficit increased $7.2 billion from the three months ending in June 2018.
- Average exports decreased $3.3 billion from June 2018.
- Average imports increased $4.0 billion from June 2018.
Exports (exhibits 3, 6, and 7)
Exports of goods decreased $3.9 billion to $137.1 billion in June.
Exports of goods on a Census basis decreased $3.8 billion.
- Consumer goods decreased $1.9 billion.
- Gem diamonds decreased $0.8 billion.
- Pharmaceutical preparations decreased $0.5 billion.
- Jewelry decreased $0.4 billion.
- Capital goods decreased $1.2 billion.
- Computer accessories decreased $0.4 billion.
- Other industrial machinery decreased $0.2 billion.
- Telecommunications equipment decreased $0.2 billion.
- Automotive vehicles, parts, and engines decreased $0.5 billion.
Net balance of payments adjustments decreased $0.1 billion.
Exports of services decreased $0.5 billion to $69.2 billion in June.
- Travel (for all purposes including education) decreased $0.4 billion.
- Transport decreased $0.1 billion.
Imports (exhibits 4, 6, and 8)
Imports of goods decreased $4.7 billion to $212.3 billion in June.
Imports of goods on a Census basis decreased $4.4 billion.
- Industrial supplies and materials decreased $3.2 billion.
- Crude oil decreased $1.4 billion.
- Other petroleum products decreased $1.0 billion.
- Fuel oil decreased $0.3 billion.
- Consumer goods decreased $0.9 billion.
- Cell phones and other household goods decreased $1.4 billion.
- Pharmaceutical preparations increased $0.6 billion.
Net balance of payments adjustments decreased $0.2 billion.
Imports of services increased $0.1 billion to $49.2 billion in June, reflecting small (less than $50 million) changes in all major service categories.
Real Goods in 2012 Dollars – Census Basis (exhibit 11)
The real goods deficit decreased $0.3 billion to $86.1 billion in June.
- Real exports of goods decreased $2.8 billion to $148.1 billion.
- Real imports of goods decreased $3.1 billion to $234.2 billion.
Revisions
Revisions to May exports
- Exports of goods were revised up $0.2 billion.
- Exports of services were revised down $0.1 billion.
Revisions to May imports
- Imports of goods were revised down less than $0.1 billion.
- Imports of services were revised down $0.1 billion.
Goods by Selected Countries and Areas: Monthly – Census Basis (exhibit 19)
The June figures show surpluses, in billions of dollars, with South and Central America ($4.8), Hong Kong ($2.3), Brazil ($1.3), and United Kingdom ($0.1). Deficits were recorded, in billions of dollars, with China ($30.2), European Union ($15.9), Mexico ($9.2), Japan ($6.2), Germany ($5.2), Canada ($3.3), Italy ($2.6), France ($1.9), Taiwan ($1.7), India ($1.6), South Korea ($1.4), OPEC ($0.3), Saudi Arabia ($0.3), and Singapore ($0.1).
- The deficit with the European Union decreased $1.0 billion to $15.9 billion in June. Exports decreased $0.5 billion to $26.7 billion and imports decreased $1.5 billion to $42.7 billion.
- The surplus with Brazil increased $0.8 billion to $1.3 billion in June. Exports increased $0.3 billion to $3.9 billion and imports decreased $0.5 billion to $2.6 billion.
- The balance with Singapore shifted from a surplus of $0.6 billion to a deficit of $0.1 billion in June. Exports decreased $0.2 billion to $2.5 billion and imports increased $0.4 billion to $2.6 billion.
----
Earlier:
2019, August, 1, 11:30:00
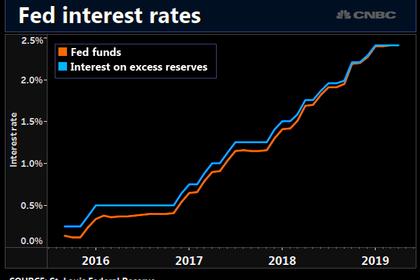
U.S. FEDERAL FUNDS RATE 2 - 2.25%
Consistent with its statutory mandate, the Committee seeks to foster maximum employment and price stability. In light of the implications of global developments for the economic outlook as well as muted inflation pressures, the Committee decided to lower the target range for the federal funds rate to 2 to 2-1/4 percent.

2019, July, 31, 13:55:00
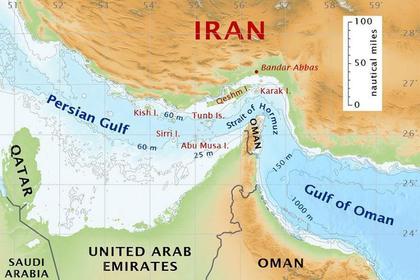
U.S., HORMUZ: HIGH PRICE
"I think Iran will look at it as a successful cost imposition to the adversary," "They're making all of the adversaries now rally forces, move them into the theater, put them at risk in the theater and pay for that presence at a very hefty price."
2019, July, 30, 12:10:00
U.S. WANTS TO CLOSE HORMUZ
"We are committed to keeping the Strait of Hormuz open and secure," Pompeo said.
2019, July, 30, 11:35:00
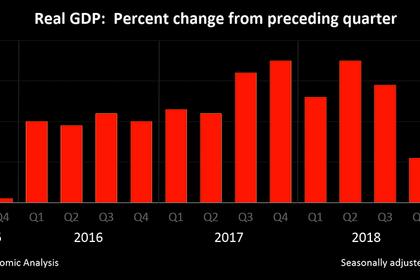
U.S. GDP UP 2.1%
U.S. Real gross domestic product (GDP) increased at an annual rate of 2.1 percent in the second quarter of 2019, according to the "advance" estimate released by the Bureau of Economic Analysis. In the first quarter, real GDP increased 3.1 percent.
2019, July, 20, 11:45:00
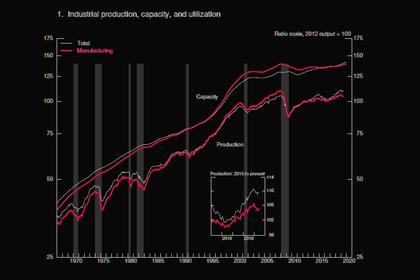
U.S. INDUSTRIAL PRODUCTION DOWN 1.2%
Industrial production was unchanged in June, as increases for both manufacturing and mining offset a decline for utilities. For the second quarter as a whole, industrial production declined at an annual rate of 1.2 percent, its second consecutive quarterly decrease.


