2019-09-26 13:45:00


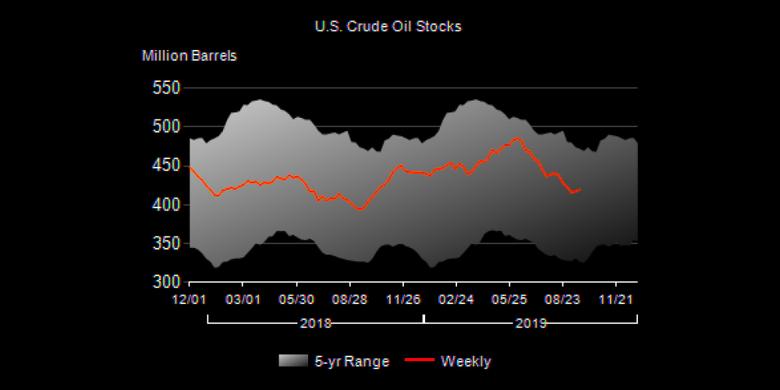
U.S. OIL INVENTORIES UP 2.4 MB TO 419.5 MB
U.S. EIA - Summary of Weekly Petroleum Status Report
U.S. crude oil refinery inputs averaged 16.5 million barrels per day during the week ending September 20, 2019, which was 193,000 barrels per day less than the previous week's average. Refineries operated at 89.8% of their operable capacity last week. Gasoline production increased last week, averaging 10.2 million barrels per day. Distillate fuel production decreased last week, averaging 5.0 million barrels per day.
U.S. crude oil imports averaged 6.4 million barrels per day last week, down by 672,000 barrels per day from the previous week. Over the past four weeks, crude oil imports averaged about 6.8 million barrels per day, 13.1% less than the same four-week period last year. Total motor gasoline imports (including both finished gasoline and gasoline blending components) last week averaged 800,000 barrels per day, and distillate fuel imports averaged 94,000 barrels per day.
U.S. commercial crude oil inventories (excluding those in the Strategic Petroleum Reserve) increased by 2.4 million barrels from the previous week. At 419.5 million barrels, U.S. crude oil inventories are at the five year average for this time of year. Total motor gasoline inventories increased by 0.5 million barrels last week and are about 4% above the five year average for this time of year. Finished gasoline inventories increased while blending components inventories decreased last week. Distillate fuel inventories decreased by 3.0 million barrels last week and are about 7% below the five year average for this time of year. Propane/propylene inventories decreased by 1.0 million barrels last week and are about 15% above the five year average for this time of year. Total commercial petroleum inventories increased last week by 0.7 million barrels last week.
Total products supplied over the last four-week period averaged 21.1 million barrels per day, up by 1.4% from the same period last year. Over the past four weeks, motor gasoline product supplied averaged 9.4 million barrels per day, down by 0.9% from the same period last year. Distillate fuel product supplied averaged 3.9 million barrels per day over the past four weeks, down by 2.0% from the same period last year. Jet fuel product supplied was down 2.1% compared with the same four-week period last year.
-----
Earlier:
2019, September, 23, 14:00:00
U.S. PETROLEUM DEMAND 21.5 MBD
Total U.S. petroleum demand of 21.5 mb/d was highest for any month since August 2005;
Improved infrastructure helped increase supply and lower prices;
Highest U.S. petroleum exports (8.1 mb/d) for the month of August; and
Total inventories increased year-on-year for the ninth consecutive month.

2019, September, 19, 14:15:00
U.S. WEAPON: OIL
Iranian Minister of Petroleum Bijan Zangeneh stressed the non-political nature of oil, saying the US was using oil as a weapon which was not the right approach.
2019, September, 17, 12:50:00
U.S. PRODUCTION: OIL + 74 TBD, GAS + 469 MCFD
U.S. EIA - Crude oil production from the major US onshore regions is forecast to increase 74,000 b/d month-over-month in September from 8,769 to 8,843 thousand barrels/day, gas production to increase 469 million cubic feet/day from 81,893 to 82,362 million cubic feet/day .
2019, September, 6, 13:50:00
U.S. SHALE OIL CUTTING
Bankruptcy filings by U.S. energy producers through mid-August this year have nearly matched the total for the whole of 2018. A stock index of oil and gas producers hit an all-time low in August, a sign investors are expecting more trouble ahead.


