2019-09-02 13:05:00


U.S. GAS PRODUCTION UP 11.5%
U.S. EIA - Natural Gas Monthly
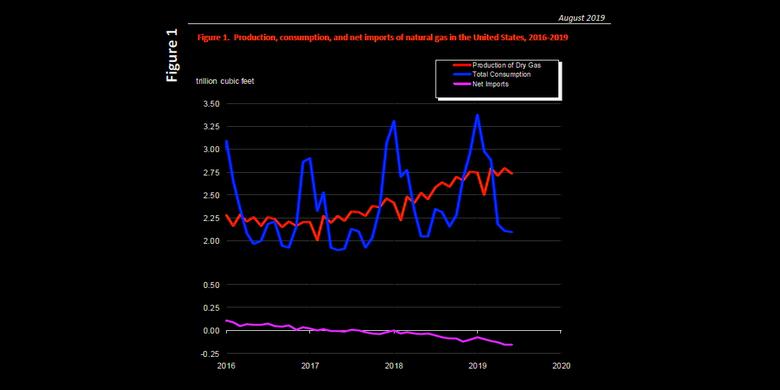
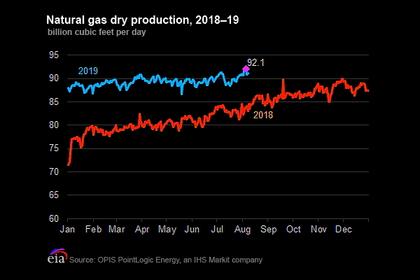
- In June 2019, for the 26th consecutive month, dry natural gas production increased year to year for the month. The preliminary level for dry natural gas production in June 2019 was 2,735 billion cubic feet (Bcf), or 91.2 Bcf/d. This level was 9.4 Bcf/d (11.5%) higher than the June 2018 level of 81.8 Bcf/d. The average daily rate of dry production was the highest for any month since EIA began tracking monthly dry production in 1997.
- The estimated natural gas consumption in June 2019 was 2,099 Bcf, or 70.0 Bcf/d. This level was 1.6 Bcf/d (2.4%) higher than the 68.3 Bcf/d consumed in June 2018. Natural gas consumption for June was the highest level for the month since 2001, when EIA began using the current definitions for consuming sectors.
- Year-over-year total consumption of dry natural gas in June 2019 increased in three of the four consuming sectors. Deliveries of natural gas by consuming sector in June 2019 were:
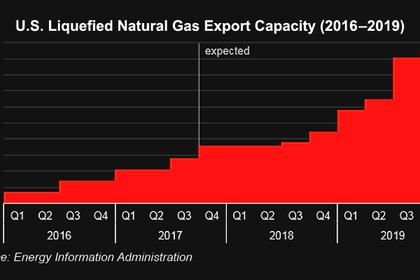
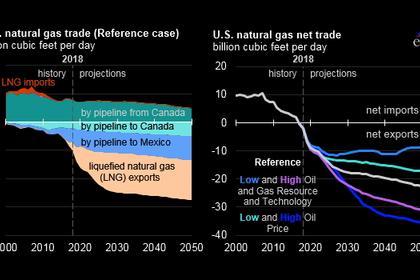
Net natural gas imports (imports minus exports) were -158 Bcf, or -5.3 Bcf/d, in June 2019, making the United States a net exporter. Total imports were 6.7 Bcf/d, a decrease of 11.8% compared with 7.6 Bcf/d in June 2018. Total exports were 12.0 Bcf/d, an increase of 37.0% compared with 8.7 Bcf/d in June 2018. Natural gas exports were the highest for the month since EIA began tracking monthly exports in 1973. The increase in exports continues to be driven by liquefied natural gas (LNG). LNG exports in June 2019 were 91.9% higher than in June 2018. In June 2019, the United States exported 4.7 Bcf/d of LNG to 19 countries. The average daily rate of LNG exports was the highest for any month since EIA began tracking them in 1997.- Residential deliveries: 129 Bcf, or 4.3 Bcf/d, which was up 8.4% compared with 4.0 Bcf/d in June 2018. Residential deliveries were the highest for the month since 2011.
- Commercial deliveries: 144 Bcf, or 4.8 Bcf/d, which was up 2.9% compared with 4.7 Bcf/d in June 2018. Commercial deliveries were the highest for the month since 2002.
- Industrial deliveries: 626 Bcf, or 20.9 Bcf/d, which was down 2.0% compared with 21.3 Bcf/d in June 2018. Despite this decrease, industrial deliveries were the second highest for the month since EIA began using the current definitions for consuming sectors in 2001.
- Electric power deliveries: 983 Bcf, or 32.8 Bcf/d, which was up 3.3% compared with 31.7 Bcf/d in June 2018. Electric power deliveries were the highest for the month since EIA began using the current definitions for consuming sectors in 2001.
-----
Earlier:
2019, August, 28, 12:35:00
U.S. LNG FOR LATIN AMERICA UP
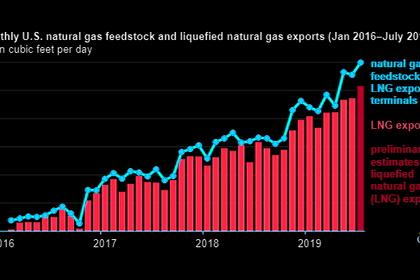
Feedgas flows to US LNG export terminals reached a new record of 6.5 Bcf/d on Friday, subject to revisions, amid robust demand in Latin America and positive netback spreads that are expected to strengthen into October,
2019, August, 21, 12:30:00
U.S. OIL, GAS PRODUCTION UP
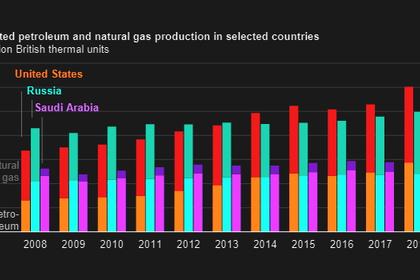
U.S. petroleum and natural gas production increased by 16% and by 12%, respectively, in 2018, and these totals combined established a new production record.
2019, August, 21, 12:25:00
U.S. LNG EXPORTS UP
U.S. LNG exports set new records in June and July 2019 at 4.8 Bcf/d and 5.2 Bcf/d, respectively,
2019, August, 16, 10:25:00
U.S. GAS PRODUCTION UP
U.S. natural gas production continued to increase in August despite relatively low natural gas spot prices
2019, August, 13, 13:25:00
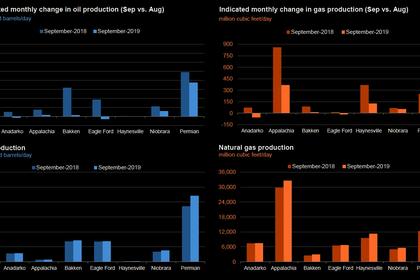
U.S. PRODUCTION: OIL + 85 TBD, GAS + 729 MCFD
U.S. EIA - Crude oil production from the major US onshore regions is forecast to increase 85,000 b/d month-over-month in August from 8,683 to 8,768 thousand barrels/day, gas production to increase 729 million cubic feet/day from 80,866 to 81,595 million cubic feet/day .
2019, August, 12, 13:20:00
U.S. GAS DEMAND UP
U.S. natural gas demand is rising as power generators shut coal plants and burn more gas for electricity and as rapidly expanding liquefied natural gas (LNG) terminals turn more of the fuel into super-cooled liquid for export.
2019, August, 12, 13:15:00
U.S. GAS SALES UP
Russian gas sales on Gazprom Export's Electronic Sales Platform (ESP) rebounded above 100 million cu m in Thursday's auction, continuing a trend of steady strong sales on the platform this month.


